In a chi-square test, we want to know if the frequency of the noodles is significantly different from what we would expect if they truly have equal chances of occurring. We already have the frequency of the noodles (in the table above), so now we need to calculate the expected frequency of the noodle types. This step is simple with this type of chi-square test: Expected frequency of X-shaped noodles is the theoretical probability of getting an X-shaped noodle times the total number of observations of noodles. We have no reason to expect an unequal probability of getting an X-shaped noodle and an O- shaped noodle, so we will expect a 50% chance for each. As such, calculate the expected cell frequency of both noodles. 4. Calculate the expected cell frequency of the noodles. Show your work by plugging in the values. Remember, px-shape represents the probability that a noodle will be shaped like an X. is the total number of noodles in our sample. N(px-shape) = ( ) = N(po-shape) = ( ) =
In a chi-square test, we want to know if the frequency of the noodles is significantly different from what we would expect if they truly have equal chances of occurring. We already have the frequency of the noodles (in the table above), so now we need to calculate the expected frequency of the noodle types. This step is simple with this type of chi-square test: Expected frequency of X-shaped noodles is the theoretical probability of getting an X-shaped noodle times the total number of observations of noodles. We have no reason to expect an unequal probability of getting an X-shaped noodle and an O- shaped noodle, so we will expect a 50% chance for each. As such, calculate the expected cell frequency of both noodles. 4. Calculate the expected cell frequency of the noodles. Show your work by plugging in the values. Remember, px-shape represents the probability that a noodle will be shaped like an X. is the total number of noodles in our sample. N(px-shape) = ( ) = N(po-shape) = ( ) =

Glencoe Algebra 1, Student Edition, 9780079039897, 0079039898, 2018
18th Edition
ISBN:9780079039897
Author:Carter
Publisher:Carter
Chapter10: Statistics
Section10.6: Summarizing Categorical Data
Problem 27PPS

Related questions

Concept explainers
Contingency Table
A contingency table can be defined as the visual representation of the relationship between two or more categorical variables that can be evaluated and registered. It is a categorical version of the scatterplot, which is used to investigate the linear relationship between two variables. A contingency table is indeed a type of frequency distribution table that displays two variables at the same time.
Binomial Distribution
Binomial is an algebraic expression of the sum or the difference of two terms. Before knowing about binomial distribution, we must know about the binomial theorem.
Topic Video
Question
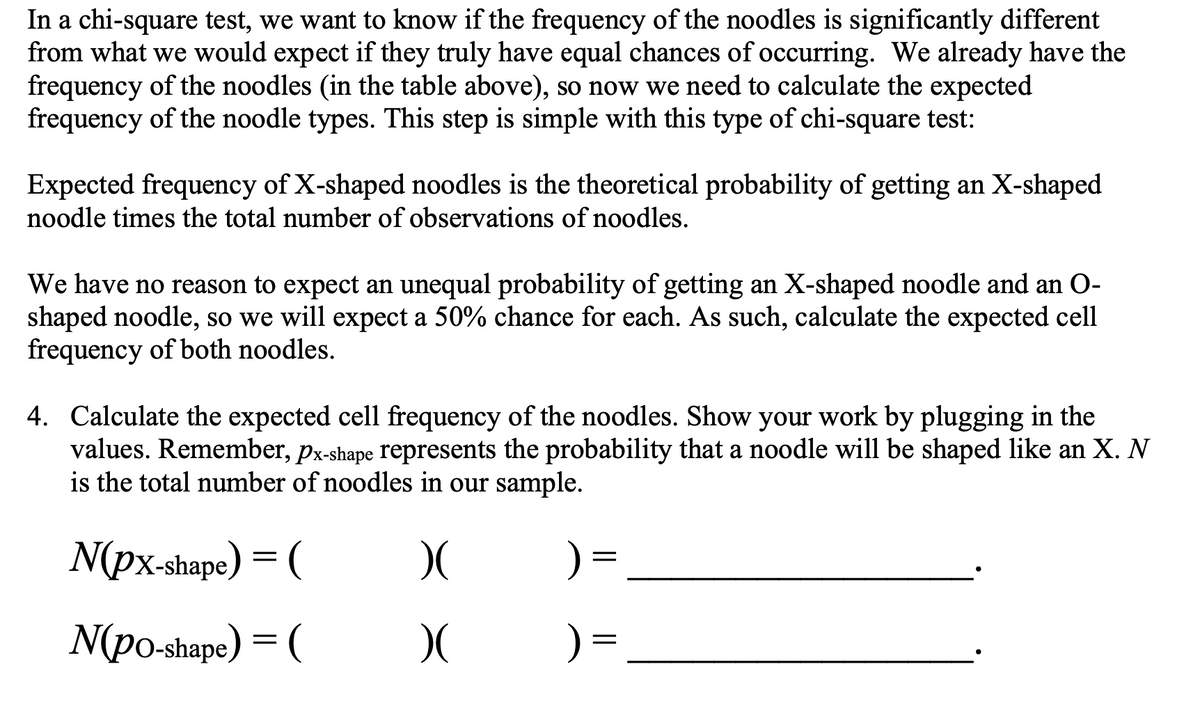
Transcribed Image Text:In a chi-square test, we want to know if the frequency of the noodles is significantly different
from what we would expect if they truly have equal chances of occurring. We already have the
frequency of the noodles (in the table above), so now we need to calculate the expected
frequency of the noodle types. This step is simple with this type of chi-square test:
Expected frequency of X-shaped noodles is the theoretical probability of getting an X-shaped
noodle times the total number of observations of noodles.
We have no reason to expect an unequal probability of getting an X-shaped noodle and an O-
shaped noodle, so we will expect a 50% chance for each. As such, calculate the expected cell
frequency of both noodles.
4. Calculate the expected cell frequency of the noodles. Show your work by plugging in the
values. Remember, px-shape represents the probability that a noodle will be shaped like an X. N
is the total number of noodles in our sample.
N(px-shape) = (
) =
N(po-shape) = (
) =
Transcribed Image Text:You are a paranoid delusional statistician with far too much time on your hands. One day, you sit
down to have a bowl of soup. This bowl of soup happens to be Tic-Tac-Toe themed, meaning
that you have some noodles that are shaped like an X, and some that are shaped like an O. As
you stir your soup, you notice that this bowl seems to have a particularly high number of X-
shaped noodles in it. Being paranoid, you conclude that this has some meaning-like someone is
trying to give you a message, possibly warning you of the dangers of x-rays. You jump out of
your seat and run to get your x-ray-proof cape, and then you pause for a moment and think that
you should calculate a chi-square statistic for the frequency of X-shaped noodles before freaking
out.
First, you carefully separate each of the noodles by shape and count them. Here is what
you
find:
Frequency ofNoodles
O-shaped
21
X-shaped
33
Expert Solution
This question has been solved!
Explore an expertly crafted, step-by-step solution for a thorough understanding of key concepts.

This is a popular solution!

Trending now
This is a popular solution!

Step by step
Solved in 2 steps

Knowledge Booster


Learn more about
Need a deep-dive on the concept behind this application? Look no further. Learn more about this topic, statistics and related others by exploring similar questions and additional content below.Recommended textbooks for you
Glencoe Algebra 1, Student Edition, 9780079039897…
Algebra
ISBN:
9780079039897
Author:
Carter
Publisher:
McGraw Hill

Glencoe Algebra 1, Student Edition, 9780079039897…
Algebra
ISBN:
9780079039897
Author:
Carter
Publisher:
McGraw Hill