In a classroom with two students, find the mean of the number of students who will be boys. The probability distribution is as follows: P(X) Мean:
In a classroom with two students, find the mean of the number of students who will be boys. The probability distribution is as follows: P(X) Мean:

College Algebra
7th Edition
ISBN:9781305115545
Author:James Stewart, Lothar Redlin, Saleem Watson
Publisher:James Stewart, Lothar Redlin, Saleem Watson
Chapter9: Counting And Probability
Section9.3: Binomial Probability
Problem 2E: If a binomial experiment has probability p success, then the probability of failure is...

Related questions
Question
2
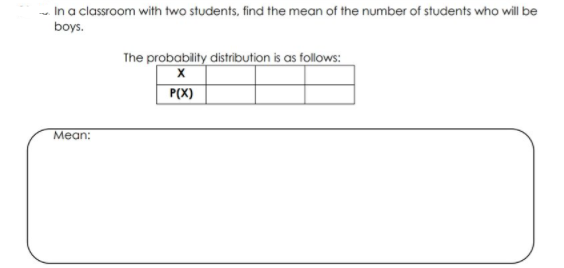
Transcribed Image Text:- In a classroom with two students, find the mean of the number of students who will be
boys.
The probability distribution is as follows:
P(X)
Мean:
Expert Solution
This question has been solved!
Explore an expertly crafted, step-by-step solution for a thorough understanding of key concepts.

Step by step
Solved in 2 steps with 2 images

Recommended textbooks for you
College Algebra
Algebra
ISBN:
9781305115545
Author:
James Stewart, Lothar Redlin, Saleem Watson
Publisher:
Cengage Learning
College Algebra
Algebra
ISBN:
9781305115545
Author:
James Stewart, Lothar Redlin, Saleem Watson
Publisher:
Cengage Learning