1. A team of scientists wants to test a new medication to see if it has either a positive or negative effect on intelligence, or no effect at all. A sample of 25 participants who have taken the medication has a mean of 150 with a standard deviation of 20. a. Calculate the degrees of freedom b. What is the t-value? c. What is your confidence level?
1. A team of scientists wants to test a new medication to see if it has either a positive or negative effect on intelligence, or no effect at all. A sample of 25 participants who have taken the medication has a mean of 150 with a standard deviation of 20. a. Calculate the degrees of freedom b. What is the t-value? c. What is your confidence level?

Glencoe Algebra 1, Student Edition, 9780079039897, 0079039898, 2018
18th Edition
ISBN:9780079039897
Author:Carter
Publisher:Carter
Chapter10: Statistics
Section10.4: Distributions Of Data
Problem 19PFA

Related questions
Question
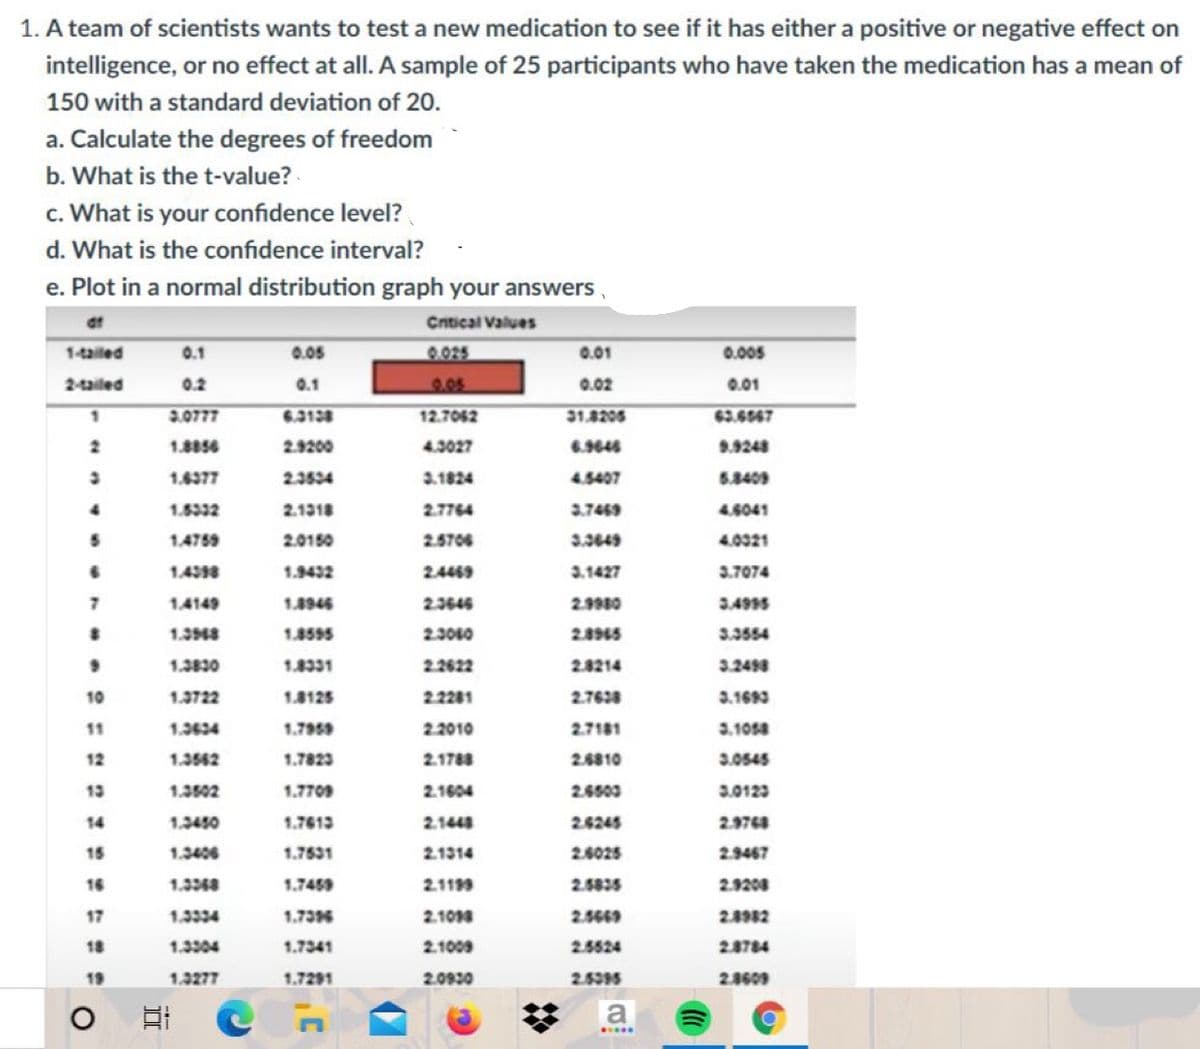
Transcribed Image Text:1. A team of scientists wants to test a new medication to see if it has either a positive or negative effect on
intelligence, or no effect at all. A sample of 25 participants who have taken the medication has a mean of
150 with a standard deviation of 20.
a. Calculate the degrees of freedom
b. What is the t-value?
c. What is your confidence level?
d. What is the confidence interval?
e. Plot in a normal distribution graph your answers,
Cnitical Values
1-tailed
0.1
0.05
0.025
0.01
0.005
2-ailed
0.2
0.1
9.05
0.02
0.01
3.0777
6.318
12.7062
31.8205
63.6567
1.8856
2.9200
4.3027
6.9646
9.9248
1.6377
2.3534
3.1824
4.5407
5.3409
1.5332
2.1318
2.7764
3.7469
4.6041
1.4759
2.0150
2.5706
3.3449
4.0321
1.4398
1.9432
24469
3.1427
3.7074
1.4149
1.4945
2.3645
2.90
1.3948
1.8595
2.3010
3.3554
1.3830
1.8331
2.2622
2.8214
3.2498
10
1.3722
1.8125
22281
2.7638
3.1693
11
1.3624
1.7959
2.2010
2.7181
3.1058
12
1.3562
1.7823
21788
2.6810
3.0545
13
1.3502
1.7709
2.1604
2.6503
3.0123
14
1.3450
1.7613
2.1448
26245
2.9768
15
1.3406
1.7531
2.1314
2.6025
2.9467
16
1.348
1.7459
2.1119
2.5835
2.1208
17
1.3334
1.736
2.1014
2.5669
2.4982
18
1.3304
1.7341
2.1009
2.5524
2.8784
19
1.3277
1.7291
2.0930
2.5395
2.8609
a
(7
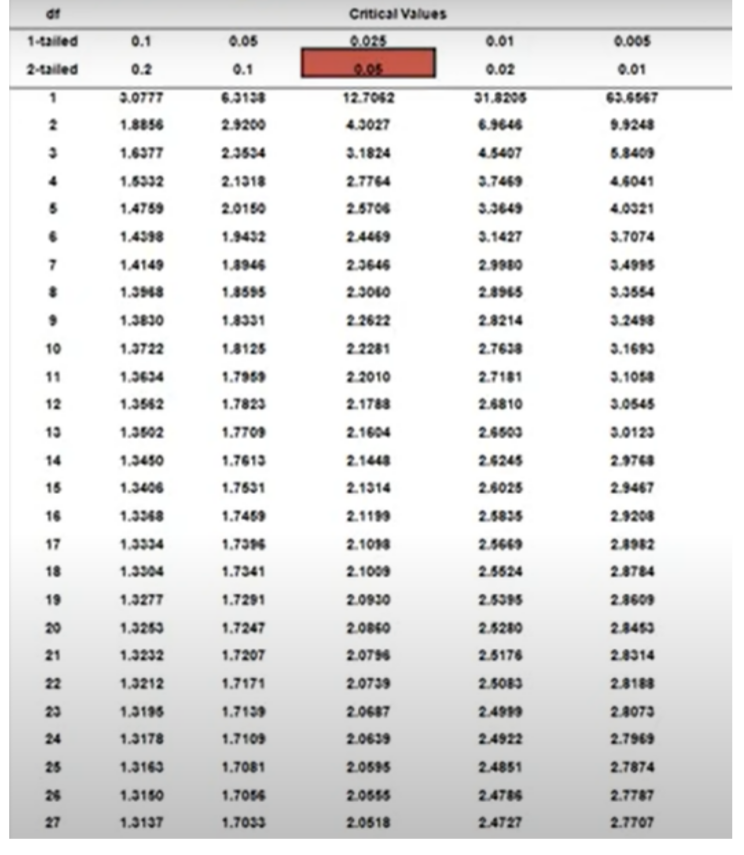
Transcribed Image Text:Critical Values
1-tailed
0.1
0.05
0.025
0.01
0.005
2-ailed
0.2
0.1
0.05
0.02
0.01
3.0777
6.31
12.7062
31.8205
63.6667
1.8856
2.9200
4.3027
6.9646
9.9248
1.6377
2.3534
3.1824
4.5407
6.8409
1.6332
2.1318
2.7764
3.7469
4.6041
1.4759
2.0150
2.5706
3.3649
4.0321
1.4398
1.9432
2.4469
3.1427
3.7074
1.4149
1.4946
2.3645
2.9980
3.4995
1.3948
1.8595
2.3010
2.8945
3.3554
1.3830
1.8331
22622
2.8214
3.2498
10
1.3722
1.8125
22281
2.7638
3.1693
11
1.3624
1.7959
2.2010
2.7181
3.1054
12
1.3562
1.7823
2.1788
2.8810
3.0645
13
1.3502
1.7709
2.1604
2.6600
3.0123
14
1.3450
1.7613
2.1448
26245
2.9764
15
1.3406
1.7631
2.1314
2.6025
2.9467
16
1.3348
1.7459
2.119
2.5835
2.9208
17
1.3334
1.736
2.1014
2.5669
2.8982
18
1.3304
1.7341
2.1009
2.5524
2.8784
19
1.3277
1.7291
2.0930
2.5395
2.3609
20
1.3253
1.7247
2.0860
2.5280
2.3453
21
1.3232
1.7207
2.0796
2.5176
2.8314
22
1.3212
1.7171
2.0739
2.5083
2.8188
23
1.3195
1.7139
2.0687
2.4919
2.4073
24
1.3178
1.7109
2.0639
2.4922
2.7969
25
1.3163
1.7081
2.0595
2.4851
2.7874
26
1.3150
1.7054
2.0655
2.4786
2.7787
27
1.3137
1.7033
2.0518
2.4727
2.7707
Expert Solution
This question has been solved!
Explore an expertly crafted, step-by-step solution for a thorough understanding of key concepts.

Step by step
Solved in 4 steps

Recommended textbooks for you
Glencoe Algebra 1, Student Edition, 9780079039897…
Algebra
ISBN:
9780079039897
Author:
Carter
Publisher:
McGraw Hill
Glencoe Algebra 1, Student Edition, 9780079039897…
Algebra
ISBN:
9780079039897
Author:
Carter
Publisher:
McGraw Hill