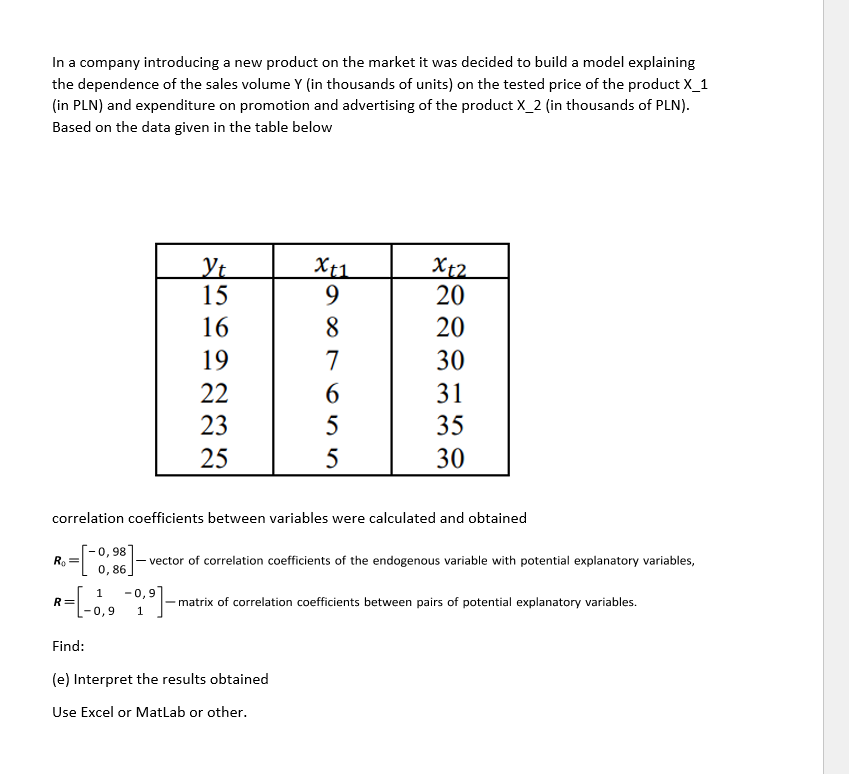
In a company introducing a new product on the market it was decided to build a model explaining the dependence of the sales volume Y (in thousands of units) on the tested price of the product X_1 (in PLN) and expenditure on promotion and advertising of the product X_2 (in thousands of PLN). Based on the data given in the table below


Q: Is in the lungs) when breathing naturally available air. Let y = partial pressure when breathing pur...
A: Hi! Thank you for the question, As per the honor code, we are allowed to answer three sub-parts at a...
Q: a) Are the conditions for creating a confidence interval satisfied? Explain. O A. No, because the sa...
A:
Q: Example What is the probability of drawing a black card or a king from a well-shuffled pack of playi...
A: We know that There are 52 card in the deck in which they divided into two color i.e red(26) and blac...
Q: The population proportion is 0.55. what is the probability that a sample proportion will be within 0...
A: Disclaimer : “Since you have posted a question with multiple sub-parts, we will solve first three s...
Q: A nutritionist claims that the mean tuna consumption by a person is 3.3 pounds per year. A sample of...
A:
Q: Ten percent of Americans are allergic to ragweed. Suppose a random sample of 200 people is selected....
A:
Q: Five different paints are marketed as having same drying time. To verify the manufacturer’s claim, ...
A: Given :
Q: Suppose Yı and Y2 are random variables with joint pdf fr,x,V1.Y2) = { o. S6(1 – y2), 0 < y1 < y2 oth...
A:
Q: 7 Example 11. The following table gives the prices of some food items in the base year and current y...
A:
Q: (b) Applying the MSE measure of forecast accuracy, would you prefer a smoothing constant of a = 0.1 ...
A: Data is given for time series value according to weeks. We have to calculate MSE, MAE, MAPE
Q: To determine whether membership to extra curricular activities among freshmen students will affect t...
A: Here first we will find mean and standard deviations for both and use two sample t-test for two tail...
Q: Given the following frequencies of the positive class, find the frequencies of the rest of the class...
A: The letters A,B,C are indicates the presences of Attribute while, the α, β, γ are indicating the abs...
Q: A retail store is trying to decide the optimal order quantity for brown sugar. During the last seven...
A:
Q: Hllus tration 13.8. Compute index numbers from the following data using (i) Laspeyre's (ii) Paasche'...
A:
Q: if there were something genetic that made people simultaneously more suceptible to both smoking and ...
A: A confounding variable is an undefined third factor that affects both the claimed cause and the clai...
Q: 10. The heights of a group of 20 students were recorded to the nearest centimeters as follows: 162, ...
A: For a set of n observations, x1, x2, ... , xn, mean is given by, And the standard deviation is give...
Q: A scientific study was conducted to determine the hours of sleep that college students get per night...
A: Given,sample size(n)=32population standard deviation(σ)=0.43α=1-0.86=0.14α2=0.07
Q: Find the critical value(s) for a left-tailed z-test with a=0.10. Include a graph with your answer. T...
A:
Q: (b) Use a = 0.1 to compute the exponential smoothing values for the time series. (Round your answers...
A: Please find the answer in the excel sheet provided.
Q: ). In two sets of variables X and Y with 50 observations each, the following data were observed. X= ...
A:
Q: A nutritional measured not only how many helpings of vegetables 125v grade- school children were eac...
A: Solution: The explanatory variable in this example is The helpings of vegetables. The response va...
Q: identify a) The research hypothesis H1 b) The null hypothesis HO c) The rejection region of the null...
A: p = proportion of graduates who get a job A published article indicates that only 1 in 3 university ...
Q: According to a study, the proportion of people who are satisfied with the way things are going in th...
A:
Q: The lengths of a particular animal's pregnancies are approximately normally distributed, with mean u...
A: As per bartelby guideline expert have to answer first three subparts only dear student please upload...
Q: A recent survey of the NHL found that the number of goals scored in Hockey *BY A PLAYER* in an 82 ga...
A:
Q: For each of the following scatter graphs 1. State a possible purpose for the chosen variables. 2. St...
A: Note: Hi there! Thank you for posting the question. As you have posted multiple questions, as per th...
Q: Try Again Your answer is incorrect. • Some of the frequencies are incorrect. The following is a list...
A:
Q: 2. Suppose Yı. Y2. Ys, and Ya are mutually independent and identically distributed exponential rando...
A: Given Yi~exp(1), i=1,2,3,4
Q: A photoconductor film is manufactured at a nominal thickness of 25 mils. The product engineer wishes...
A: Given that a..We have to find test the claim that reducing the film thickness increases the mean...
Q: Compute coefficient of quartile deviation from the following data : Marks 10 20 30 40 50 60 No. of S...
A:
Q: . Convert the following fixed base index numbers into chain base index numbers.
A: Firstly it is required to calculate the link relatives for each index number as L.R = (current year ...
Q: The following data present the yields in quintals of common ten subdivisions of equal area of two ag...
A:
Q: Illustration 13,23. The following table gives the monthly wag and cost of living index no. based on ...
A:
Q: p = proportion of students who drop out due to lack of economic resources A sociologist thinks that ...
A: The claim is that the percentage of students who drop out due to lack of economic resources is diffe...
Q: 13.14. Owing to change in pri1ces consumer prict index of the working class in a certain area rose i...
A:
Q: The mean height of 25 male workers in a factory is 61 inches and the height of 35 female workers in ...
A: Given data,No of male workers n1=25Mean of male workers is m1=61No of female workers is n2=35Mean of...
Q: A facilities supervisor at a sports stadium wants to rate the condition of the seats at the stadium....
A: Convenience sampling Convenience sampling is a type of non-probability sampling that involves ...
Q: You want to obtain a sample to estimate a population mean. Based on previous evidence, you believe t...
A:
Q: Identify the margin of error.
A:
Q: Given the u = 27 and o = 7, compute the z-score that corresponds to the given score X = 44. Round yo...
A:
Q: From the following data compute Quartile Deviation : Size : 4- 7 8-10 11-13 14-16 17-19 Frequency 14...
A:
Q: We wish to estimate what percent of adult residents in a certain county are parents. Out of 200 adul...
A: We wish to estimate what percent of adult residents in a certain county are parents. Out of 200 adul...
Q: ALPHA = 0.01 Shift 1 2 3 Machine A 10 8 6 B 6 12 8 C 6 6...
A: Given :
Q: (c) What is the forecast for the next month (in millions of dollars) using exponential smoothing wit...
A: Data for time series value is given according to months We have to calculate forcast for next month ...
Q: A company claims that the mean monthly residential electricity consumption in a certain region is mo...
A:
Q: Construct a confidence interval for β1 from the data set below with 95% confidence. Interpret the re...
A: For the given table Construct a confidence interval for β1 with 95% confidence. Interpret the result...
Q: The mean height of 25 male workers in a factory is 61 inches and the mean height of 35 female worker...
A:
Q: (d) If the sizes of five independently selected droplets are measured, what is the probability that ...
A:
Q: Suppose we sample from an exponential distribution with parameter 0. In the class we con- structed a...
A:
Q: A ball is drawn randomly from a jar that contains 6 red balls, 4 white balls, and 8 yellow ball. Fin...
A: We have given that the jar contains 6 red balls, 4 white balls and 8 yellow balls. The total number ...

Step by step
Solved in 2 steps

- The Pilot Pen Company has decided to use 15 test markets to examine the sensitivity of demand for its new product to various prices, as shown in the following table. Advertising effort was identical in each market. Each market had approximately the same level of business activity and population.a. Using a linear regression model, estimate the demand function for Pilot’s new pen.b. Evaluate this model by computing the coefficient of determination and by performing a t-test of the significance of the price variable.c. What is the price elasticity of demand at a price of 50 cents? TEST MARKET PRICE CHARGED (¢) QUANTITY SOLD(THOUSANDS OF PENS) 1 2 3 4 5 6 7 8 9 10 11 12 13 14 15 50 50 55 55 60 60 65 65 70 70¢ 80 80 90¢ 90 40 20.0 21.0 19.0 19.5 20.5 19.0 16.0 15.0 14.5 15.5 13.0 14.0 11.5 11.0 17.0A fast-food chain decided to carry out an experiment to assess the influence of advertising expenditure on sales. Different relative changes in advertising expenditure, compared to the previous year, were made in eight regions of the country, and resulting changes in sales levels were observed the accompanying table shows the results. Increase in advertising expenditure (%) 0 5 15 20 25 30 35 40 Increase in sales (%) 5 10 18 25 35 50 60 65 Determine the value of ∑X, ∑X2, ∑Y, ∑Y2, ∑XY. Where X represent independent variable and Y for dependent variable. Determine and interpret the coefficient of correlation between the two variables. Determine the value of regressions coefficients and write down the simple linear regression model.…A fast-food chain decided to carry out an experiment to assess the influence of advertising expenditure on sales. Different relative changes in advertising expenditure, compared to the previous year, were made in eight regions of the country, and resulting changes in sales levels were observed the accompanying table shows the results. Increase in advertising expenditure (%) 0 5 15 20 25 30 35 40 Increase in sales (%) 5 10 18 25 35 50 60 65 Determine the value of ∑X, ∑X2, ∑Y, ∑Y2, ∑XY. Where X represent independent variable and Y for dependent variable. Determine and interpret the coefficient of correlation between the two variables. Determine the value of regressions coefficients and write down the simple linear regression model. Test the validity of the model…
- A survey of 28 employed workers found that the correlation coefficient between the number of years of post-secondary education and current annual income in dollars is -0.38. The researchers hypothesize a positive relationship between number of years of post-secondary education and annual income. What can the researchers conclude with α = 0.05? a) Obtain/compute the appropriate values to make a decision about H0. critical value= test statistic= b) effect size= C) 1)There is a significant positive relationship between years of post-secondary education and current annual income. 2)There is a significant negative relationship between years of post-secondary education and current annual income. 3) There is no significant relationship between years of post-secondary education and current annual income.Here is a dataset containing plant growth measurements of plants grown in solutions of commonly-found chemicals in roadway runoff.Phragmites australis, a fast-growing non-native grass common to roadsides and disturbed wetlands of Tidewater Virginia, was grown in a greenhouse and watered with either: Distilled water (control); A weak petroleum solution (representing standard roadway runoff); Sodium chloride solution; Magnesium chloride solution; De-icing brine (50% sodium chloride and 50% magnesium chloride).Twenty grass preparations were used for each solution, and total growth (in cm) was recorded after watering every other day for 40 days.-Perform the correct statistical test to determine the p-value.-Report your answer rounded to four decimal places.-You should use formulas, functions, and the Data Analysis ToolPak in MS Excel to avoid additive rounding errors. Here are some useful functions: =t.test(array1,array2,tails,type) Produces a p-value for any…During the spring of 1999, many fuel storage facilities in Serbia were destroyed by bombing. As a result, significant quantities of oil products were spilled and burned,resulting in soil pollution. The article “Mobility of Heavy Metals Originating from Bombing of Industrial Sites” (B. Škrbić, J. Novaković, and N. Miljević, Journal of Environmental Science and Health, 2002:7–16) reports measurements of heavy metal concentrations at several industrial sites in June 1999, just after the bombing, and again in March of 2000. At the Smederevo site, on the banks of the Danube River, eight soil specimens taken in 1999 had an average lead concentration (in mg/kg) of 10.7 with a standard deviation of 3.3. Four specimens taken in 2000 had an average lead concentration of 33.8 with a standard deviation of 0.50. Find a 95% confidence interval for the increase in lead concentration between June 1999 and March 2000.
- An urban community wants to show that the incidence of breast cancer is higher in their locality than in a neighboring rural area. (PCB levels were found to be higher in the soil of the urban community). If you find that in the urban community 20 out of 200 adult women have breast cancer and that in the rural community 10 out of 150 adult women have it, could you conclude, at a significance level of 0.05, that breast cancer is more prevalent in the urban community?1. The parameter of interest is:2. The hypotheses for this test are:3. The calculated test statistic is:4. The critical region is:5. Draw the critical region (make decision):6. It can be concluded that:Data was collected on 54 observations on a response of interest, y, and four potential predictor variables x1, x2, x3, and x4. The output from regression analyses of the data is attached to the end of the page. d) Is the variable from your best simple linear regression model (from part a) included in the model with the lowest overall MSE (part b)? Briefly explain why it could happen that the best single variable is not in the best overall model. e) Following the best subsets regression results, the sums of squares for regression and error (also called residual) are displayed for several models. Using the regression sums of squares information for the full model containing all four x variables, calculate i) the R2 value for the full model, ii) the F statistic for the test of the H0: b1 = b2 = b3 = b4 = 0, and iii) the standard deviation of the residuals for the full model. f) Using the regression sums of squares information, test the null hypothesis H0:b2 = b4 = 0 for the full model.…A deficiency of the trace element selenium in the diet can negatively impact growth, immunity, muscle and neuromuscular function, and fertility. The introduction of selenium supplements to dairy cows is justified when pastures have low selenium levels. Authors of a research paper supplied the following data on milk selenium concentration (mg/L) for a sample of cows given a selenium supplement (the treatment group) and a control sample given no supplement, both initially and after a 9-day period. Initial Measurement Treatment Control 11.2 9.1 9.6 8.7 10.1 9.7 8.5 10.8 10.3 10.9 10.6 10.6 11.7 10.1 9.7 12.3 10.8 8.8 10.3 10.4 10.4 10.9 11.2 10.4 9.4 11.6 10.6 10.9 10.7 8.4 After 9 Days Treatment Control 138.3 9.3 104 8.7 96.4 8.7 89 10.1 88 9.6 103.8 8.6 147.3 10.2 97.1 12.2 172.6 9.3 146.3 9.5 99 8.2 122.3 8.9 103 12.5 117.8 9.1 121.5 93 (a) Use the given data for the treatment group to determine if there…
- A deficiency of the trace element selenium in the diet can negatively impact growth, immunity, muscle and neuromuscular function, and fertility. The introduction of selenium supplements to dairy cows is justified when pastures have low selenium levels. Authors of a research paper supplied the following data on milk selenium concentration (mg/L) for a sample of cows given a selenium supplement (the treatment group) and a control sample given no supplement, both initially and after a 9-day period. Initial Measurement Treatment Control 11.3 9.1 9.7 8.7 10.1 9.7 8.5 10.8 10.4 10.9 10.7 10.6 11.8 10.1 9.8 12.3 10.6 8.8 10.4 10.4 10.2 10.9 11.3 10.4 9.2 11.6 10.7 10.9 10.8 8.2 After 9 Days Treatment Control 138.3 9.4 104 8.8 96.4 8.8 89 10.1 88 9.7 103.8 8.7 147.3 10.3 97.1 12.3 172.6 9.4 146.3 9.5 99 8.3 122.3 8.9 103 12.5 117.8 9.1 121.5 93 (a) Use the given data for the treatment group to determine if…A deficiency of the trace element selenium in the diet can negatively impact growth, immunity, muscle and neuromuscular function, and fertility. The introduction of selenium supplements to dairy cows is justified when pastures have low selenium levels. Authors of a research paper supplied the following data on milk selenium concentration (mg/L) for a sample of cows given a selenium supplement (the treatment group) and a control sample given no supplement, both initially and after a 9-day period. Initial Measurement Treatment Control 11.4 9.1 9.6 8.7 10.1 9.7 8.5 10.8 10.2 10.9 10.6 10.6 11.9 10.1 9.9 12.3 10.7 8.8 10.2 10.4 10.3 10.9 11.4 10.4 9.3 11.6 10.6 10.9 10.9 8.3 After 9 Days Treatment Control 138.3 9.2 104 8.9 96.4 8.9 89 10.1 88 9.6 103.8 8.6 147.3 10.4 97.1 12.4 172.6 9.2 146.3 9.5 99 8.4 122.3 8.8 103 12.5 117.8 9.1 121.5 93 (a) Use the given data for the treatment group to determine if…Accumulation of mercury (Hg) in fish is hypothesized to correlate with the fish size. Barbonymus schwanenfeldii is a species commonly found in a dam in Sarawak. Table 1 shows data of Hg concentration (mg/kg) present in three sizes of fish caught in the dam in triplicates. (i, ii, iii was already answered.)