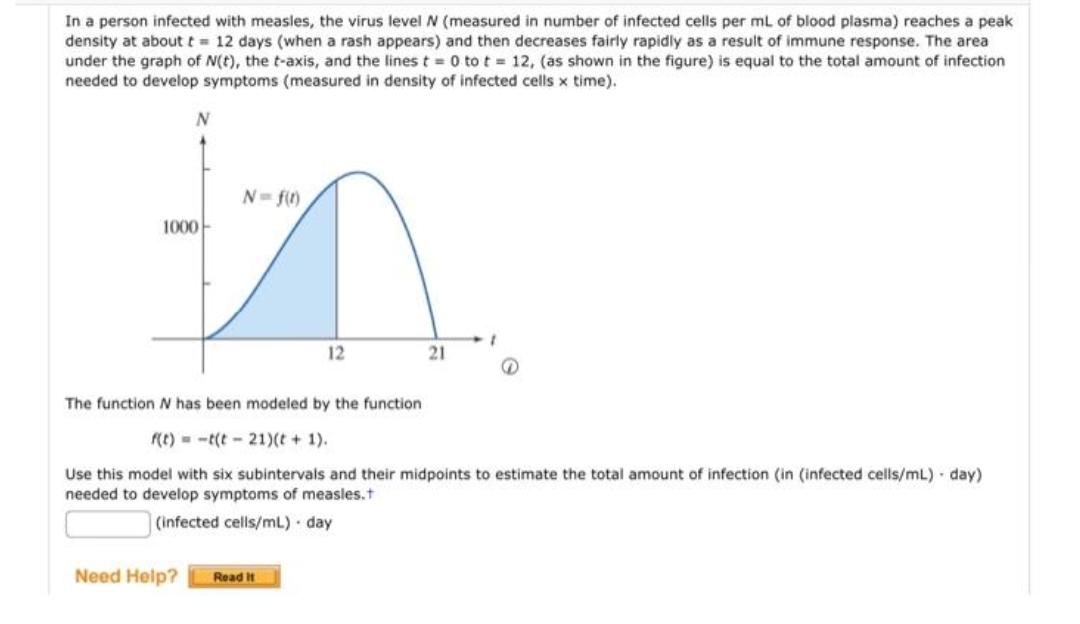
In a person infected with measles, the virus level N (measured in number of infected cells per ml of blood plasma) reaches a peak density at about t = 12 days (when a rash appears) and then decreases fairly rapidly as a result of immune response. The area under the graph of N(t), the t-axis, and the lines t = 0 tot = 12, (as shown in the figure) is equal to the total amount of infection needed to develop symptoms (measured in density of infected cells x time).
In a person infected with measles, the virus level N (measured in number of infected cells per ml of blood plasma) reaches a peak density at about t = 12 days (when a rash appears) and then decreases fairly rapidly as a result of immune response. The area under the graph of N(t), the t-axis, and the lines t = 0 tot = 12, (as shown in the figure) is equal to the total amount of infection needed to develop symptoms (measured in density of infected cells x time).

College Physics
11th Edition
ISBN:9781305952300
Author:Raymond A. Serway, Chris Vuille
Publisher:Raymond A. Serway, Chris Vuille
Chapter1: Units, Trigonometry. And Vectors
Section: Chapter Questions
Problem 1CQ: Estimate the order of magnitude of the length, in meters, of each of the following; (a) a mouse, (b)...

Related questions
Question
100%
Transcribed Image Text:In a person infected with measles, the virus level N (measured in number of infected cells per ml of blood plasma) reaches a peak
density at about t 12 days (when a rash appears) and then decreases fairly rapidly as a result of immune response. The area
under the graph of N(t), the t-axis, and the lines t = 0 to t = 12, (as shown in the figure) is equal to the total amount of infection
needed to develop symptoms (measured in density of infected cells x time).
N= f)
1000-
12
21
The function has been modeled by the function
(t) = -t(t - 21)(t + 1).
Use this model with six subintervals and their midpoints to estimate the total amount of infection (in (infected cells/mL) - day)
needed to develop symptoms of measles.t
(infected cells/mL) day
Need Help?
Read It
Expert Solution
This question has been solved!
Explore an expertly crafted, step-by-step solution for a thorough understanding of key concepts.

This is a popular solution!

Trending now
This is a popular solution!

Step by step
Solved in 2 steps with 2 images

Knowledge Booster


Learn more about
Need a deep-dive on the concept behind this application? Look no further. Learn more about this topic, physics and related others by exploring similar questions and additional content below.Recommended textbooks for you
College Physics
Physics
ISBN:
9781305952300
Author:
Raymond A. Serway, Chris Vuille
Publisher:
Cengage Learning

University Physics (14th Edition)
Physics
ISBN:
9780133969290
Author:
Hugh D. Young, Roger A. Freedman
Publisher:
PEARSON

Introduction To Quantum Mechanics
Physics
ISBN:
9781107189638
Author:
Griffiths, David J., Schroeter, Darrell F.
Publisher:
Cambridge University Press
College Physics
Physics
ISBN:
9781305952300
Author:
Raymond A. Serway, Chris Vuille
Publisher:
Cengage Learning
University Physics (14th Edition)
Physics
ISBN:
9780133969290
Author:
Hugh D. Young, Roger A. Freedman
Publisher:
PEARSON
Introduction To Quantum Mechanics
Physics
ISBN:
9781107189638
Author:
Griffiths, David J., Schroeter, Darrell F.
Publisher:
Cambridge University Press

Physics for Scientists and Engineers
Physics
ISBN:
9781337553278
Author:
Raymond A. Serway, John W. Jewett
Publisher:
Cengage Learning

Lecture- Tutorials for Introductory Astronomy
Physics
ISBN:
9780321820464
Author:
Edward E. Prather, Tim P. Slater, Jeff P. Adams, Gina Brissenden
Publisher:
Addison-Wesley

College Physics: A Strategic Approach (4th Editio…
Physics
ISBN:
9780134609034
Author:
Randall D. Knight (Professor Emeritus), Brian Jones, Stuart Field
Publisher:
PEARSON