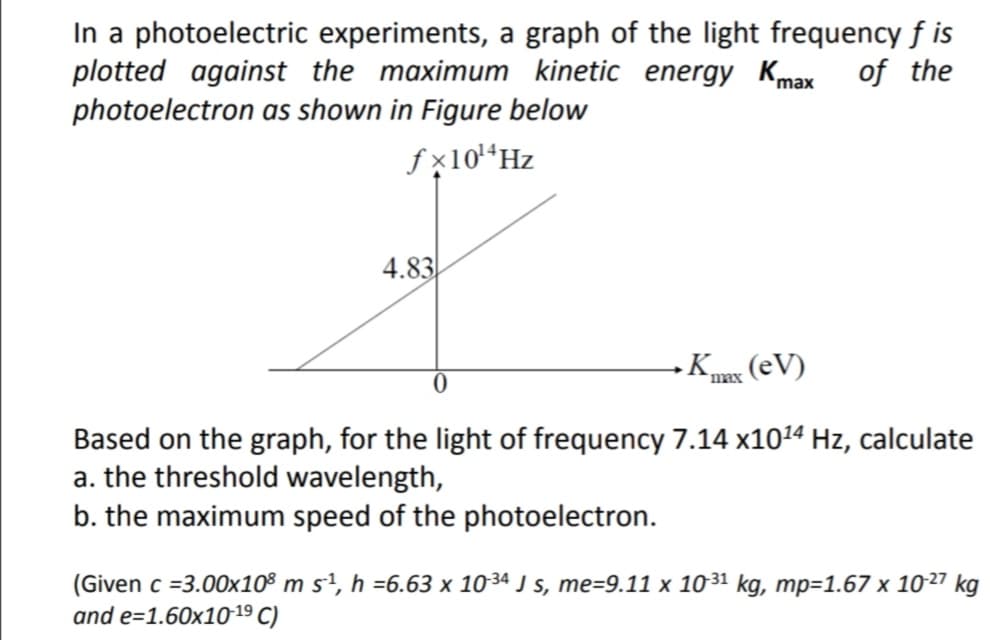
In a photoelectric experiments, a graph of the light frequency f is plotted against the maximum kinetic energy Kmax of the photoelectron as shown in Figure below fx10*Hz 4.83 TEx (eV) `max Based on the graph, for the light of frequency 7.14 x1024 Hz, calculate a. the threshold wavelength, b. the maximum speed of the photoelectron. (Given c =3.00x10° m s², h =6.63 x 1034 J s, me=9.11 x 1031 kg, mp=1.67 x 1027 kg and e=1.60x10¹⁹ C)
In a photoelectric experiments, a graph of the light frequency f is plotted against the maximum kinetic energy Kmax of the photoelectron as shown in Figure below fx10*Hz 4.83 TEx (eV) `max Based on the graph, for the light of frequency 7.14 x1024 Hz, calculate a. the threshold wavelength, b. the maximum speed of the photoelectron. (Given c =3.00x10° m s², h =6.63 x 1034 J s, me=9.11 x 1031 kg, mp=1.67 x 1027 kg and e=1.60x10¹⁹ C)

Related questions
Question
Transcribed Image Text:In a photoelectric experiments, a graph of the light frequency f is
plotted against the maximum kinetic energy Kmax of the
photoelectron as shown in Figure below
fx10“Hz
4.83
K (eV)
max
Based on the graph, for the light of frequency 7.14 x10¹⁴ Hz, calculate
a. the threshold wavelength,
b. the maximum speed of the photoelectron.
(Given c =3.00x10® m s1, h =6.63 x 1034ª J s, me=9.11 x 1031 kg, mp=1.67 x 1027 kg
and e=1.60x10¹⁹ C)
Expert Solution
This question has been solved!
Explore an expertly crafted, step-by-step solution for a thorough understanding of key concepts.

Step by step
Solved in 3 steps
