In a random sample of 64 audited estate tax returns, it was determined that the mean amount of additional tax owed was $3476 with a standard deviation of $2569. Construct and interpret a 90% confidence interval for the mean additional amount of tax owed for estate tax returns. Find and interpret a 90% confidence interval for the mean additional amount of tax owed for estate tax returns. Select the correct choice below and fill in the answer boxes to complete your choice. (Use ascending order. Round to the nearest dollar as needed.) A.There is a 90% probability that the mean additional tax owed is between $____ and $_____. B. 90% of taxes owed for estate tax returns are between $_____ and $____. C. One can be 90% confident that the mean additional tax owed is between $____ and$_____.
In a random sample of 64 audited estate tax returns, it was determined that the mean amount of additional tax owed was $3476 with a standard deviation of $2569. Construct and interpret a 90% confidence interval for the mean additional amount of tax owed for estate tax returns. Find and interpret a 90% confidence interval for the mean additional amount of tax owed for estate tax returns. Select the correct choice below and fill in the answer boxes to complete your choice. (Use ascending order. Round to the nearest dollar as needed.) A.There is a 90% probability that the mean additional tax owed is between $____ and $_____. B. 90% of taxes owed for estate tax returns are between $_____ and $____. C. One can be 90% confident that the mean additional tax owed is between $____ and$_____.

MATLAB: An Introduction with Applications
6th Edition
ISBN:9781119256830
Author:Amos Gilat
Publisher:Amos Gilat
Chapter1: Starting With Matlab
Section: Chapter Questions
Problem 1P

Related questions
Question
100%
In a random sample of 64 audited estate tax returns, it was determined that the
Find and interpret a 90% confidence interval for the mean additional amount of tax owed for estate tax returns. Select the correct choice below and fill in the answer boxes to complete your choice.
(Use ascending order. Round to the nearest dollar as needed.)
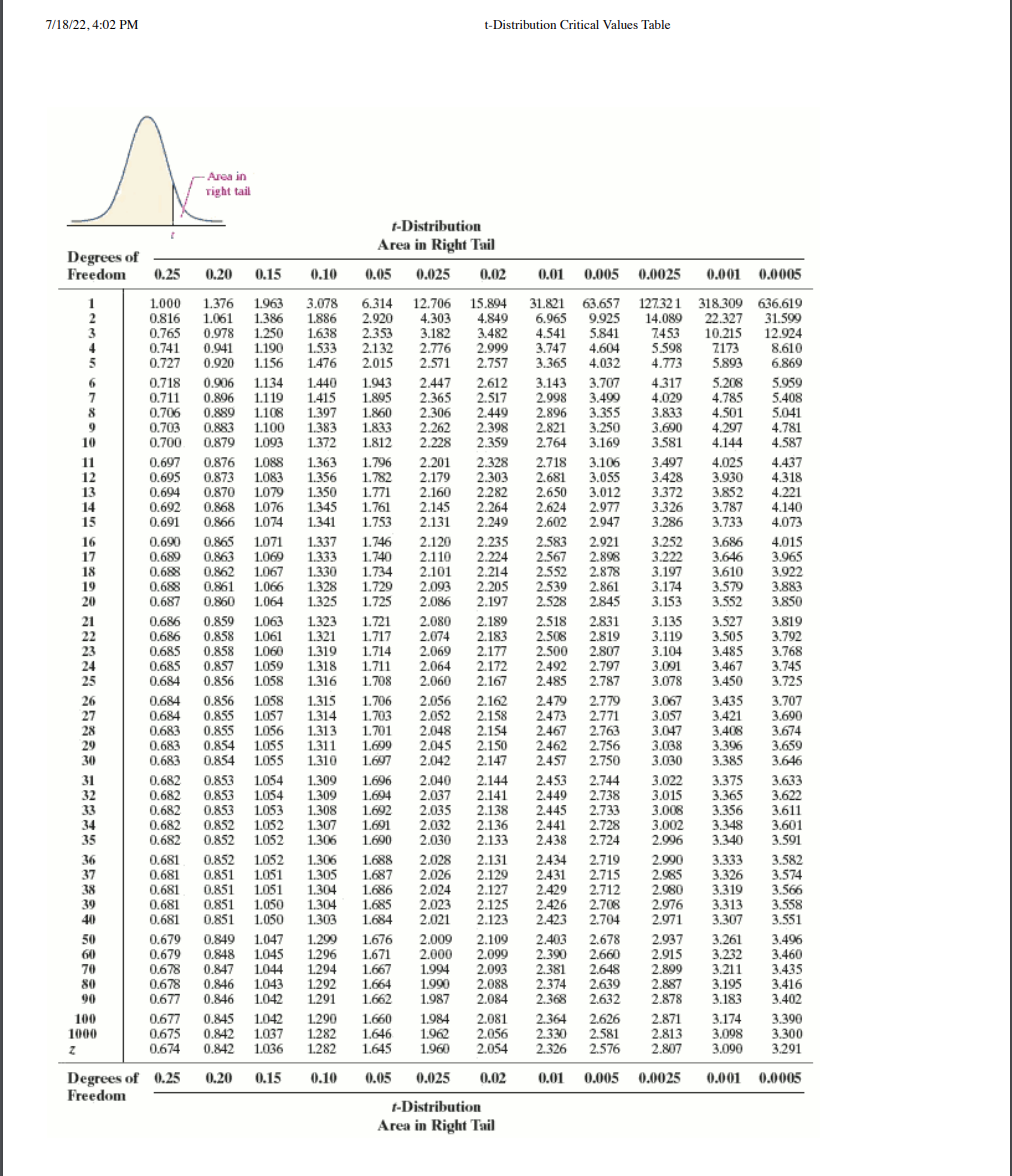
Transcribed Image Text:7/18/22, 4:02 PM
TAMAN PERASA= 228 58830 86888 =8ZA AHAAS GERAR
Degrees of
Freedom 0.25
1
11
12
13
14
15
16
17
18
19
20
21
22
23
25
26
27
30
31
32
33
34
35
36
37
38
39
40
50
60
70
0.852 1.052
1.306 1.688
0.851 1.051 1.305 1.687
0.851 1.051 1.304
0.851 1.050 1.304
0.851 1.050 1.303
0.679 0.849 1.047 1.299 1.676
0.679 0.848 1.045 1.296 1.671
0.678
0.847
1.044 1.294
1.667 1.994
0.678 0.846 1.043 1.292 1.664
1.990
0.677
1.987
0.677 0.845 1.042 1.290 1.660 1.984
0.675 0.842 1.037 1.282 1.646 1.962 2.056
0.674
0.842 1.036 1.282 1.645 1.960 2.054
Degrees of 0.25 0.20 0.15 0.10
Freedom
0.846 1.042 1.291 1.662
0.05 0.025
0.02
t-Distribution
Area in Right Tail
80
90
t
100
1000
z
t-Distribution
Area in Right Tail
0,20
0.15
0.05 0.025 0.02
0.01 0.005 0.0025 0.001 0.0005
8.610
5.893
6.869
1.000 1.376 1.963 3.078 6.314 12.706 15.894 31.821 63.657 127.321 318.309 636.619
0.816 1.061 1.386 1.886 2.920 4.303 4.849 6.965 9.925 14.089 22.327 31.599
0.765 0.978 1.250 1.638 2.353 3.182 3.482 4.541 5.841 7453 10.215 12.924
0.741 0.941 1.190 1.533 2.132 2.776 2.999 3.747 4.604 5.598 7173
0.727 0.920 1.156 1.476 2.015 2.571 2.757 3.365 4.032 4.773
0.718 0.906 1.134 1.440 1.943 2.447
2.612
3.143 3.707
0.711
0.711 0.896 1.119 1.415 1.895 2.365 2.517 2.998
0.706 0.889 1.108 1.397 1.860 2.306 2.449 2.896
0.703 0.883 1.100 1.383
2.262
1.833
2.398 2.821
1.093 1.372 1.812 2.228 2.359 2.764
1.088
2.201
5.208
4.317
3.499 4.029 4.785
3.833
4.501
3.355
3.250
3.690
3.600
4.297
0.700 0.879
3.169
3.581 4.144
1.363
1.796
2.328 2.718 3.106
2.681
3.055
2.650 3.012
0.694 0.870
2.264
0.692 0.868
0.866
2.145
2.131
2.249
2.120
2.235
2.583
2.110 2.224 2.567
0.689
0.688
2.552
2.878
0.688
0.687
1.063
0.859
0.858
1.323 1.721
1.061 1.321 1.717
0.686
0.685
0.858
0.685 0.857
1.059
1.058
0.684
1.083 1.356 1.782 2.179 2.303
1.079 1.350 1.771 2.160 2.282
1.076 1.345 1.761
0.691
1.074 1.341 1.753
0.690 0.865 1.071 1.337 1.746
0.863 1.069 1.333 1.740
0.862 1.067 1.330 1.734 2.101
2.214
0.861 1.066 1.328 1.729 2.093 2.205 2.539 2.861
0.860 1.064 1.325 1.725 2.086 2.197 2.528 2.845
2.080 2.189
2.074
2.183
1.060 1.319 1.714 2.069
2.177
1.318 1.711 2.064 2.172
0.856
1.316 1.708 2.060 2.167
0.856 1.058 1.315
0.684 0.855 1.057
1.314 1.703
0.683 0.855 1.056 1.313 1.701
0.683 0.854 1.055 1.311 1.699
0.683 0.854 1.055 1.310 1.697
0.682 0.853 1.054 1.309 1.696
0.682 0.853 1.054 1.309 1.694
0.682 0.853 1.053 1.308 1.692
0.682 0.852 1.052 1.307 1.691
0.682 0.852 1.052
0.681
0.681
0.681
0.681
0.681
0.684
1.706 2.056 2.162
1.306 1.690
-Area in
right tail
0.697 0.876
0.695 0.873
0.686
t-Distribution Critical Values Table
0.10
2.624 2.977
2.602 2.947
2.921
2.898
2.434 2.719
2.715
2.431
2.429
2.426
2.423 2.704
2.518 2.831
2.508 2.819
2.500 2.807
2.492 2.797
2.485 2.787
2.479 2.779
2.473 2.771
2.457 2.750
2.052 2.158
2.048 2.154 2.467 2.763
2.045 2.150 2.462 2.756
2.042 2.147
2.040 2.144 2.453 2.744
2.037 2.141 2.449 2.738
2.035 2.138 2.445 2.733
2.032 2.136 2.441 2.728
2.030
2.133
2.028
2.438 2.724
2.131
2.026
2.129
2.937 3.261
2.915 3.232
1.686 2.024 2.127
1.685 2.023 2.125
1.684 2.021
2.123
2.009 2.109 2.403 2.678
2.000 2.099 2.390 2.660
2.093 2.381 2.648 2.899 3.211
2.088 2.374 2.639 2.887 3.195
2.084 2.368 2.632 2.878 3.183
2.081 2.364 2.626 2.871 3.174 3.390
2.330 2.581 2.813 3.098 3.300
2.326 2.576 2.807 3.090 3.291
0.01 0.005 0.0025 0.001 0.0005
2.712
2.706
3.497 4.025
4.437
3.428 3.930 4.318
3.372 3.852 4.221
3.326 3.787 4.140
3.286 3.733
4.073
4.015
3.965
3.922
3.883
3.850
3.252 3.686
3.222 3.646
3.197 3.610
3.174 3.579
3.153 3.552
3.135 3.527
3.119 3.505
3.104 3.485
3.091 3.467
3.078 3.450
3.067 3.435
3.057 3.421
3.047
3.408
3.038
3.396
3.030
3.385
3.022 3.375
3.015 3.365
3.008 3.356
3.002 3.348
2.996 3.340
5.959
5.408
5.041
4.781
4.587
2.990 3.333
2.985
3.326
3.319
3.313
3.307
2.980
2.976
2.971
3.819
3.792
3.768
3.745
3.725
3.707
3.690
3.674
3.659
3.646
3.633
3.622
3.611
3.601
3.591
3.582
3.574
3.566
3.558
3.551
3.496
3.460
3.435
3.416
3.402
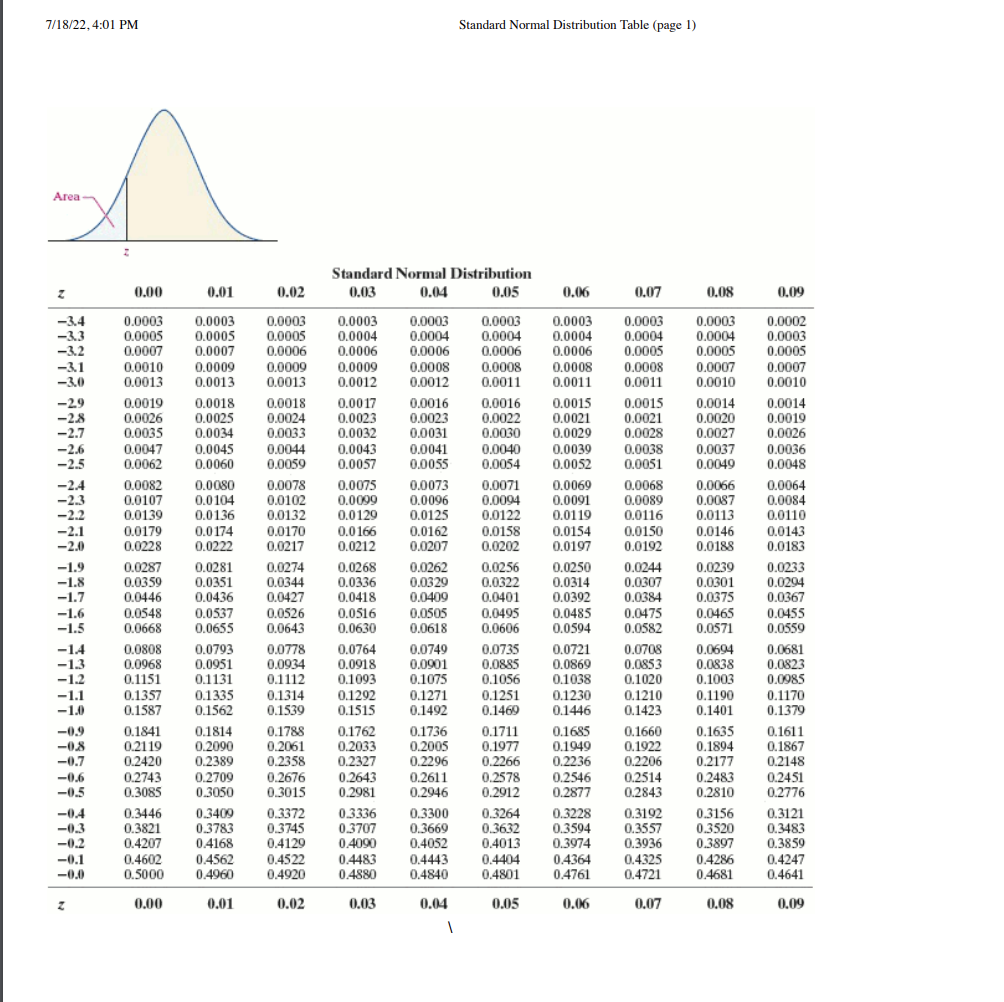
Transcribed Image Text:7/18/22, 4:01 PM
Area-
z
-3.4
-3.3
-3.2
-3.1
-3.0
-2.9
-2.8
-2.7
-2.6
-2.5
-2.4
-2.3
-2.2
-2.1
-2.0
-1.9
-1.8
-1.7
-1.6
-1.5
-14
-1.3
-1.2
-1.1
-1.0
-0.9
-0.8
-0.7
-0.6
-0.5
-0.4
-0.3
-0.2
-0.1
-0.0
z
z
0.00
0.01
0.0003 0.0003
0.0005 0.0005
0.0007
0.0007
0.0010
0.0013
0.0082 0.0080
0.0107 0.0104
0.0139
0.0136
0.0179
0.0174
0.0228
0.0222
0.0009
0.0013
0.0019
0.0018 0.0018 0.0017
0.0026
0.0025
0.0035
0.0034
0.0047 0.0045
0.0062 0.0060
0.0548 0.0537
0.0668
0.0655
0.0808
0.0968
0.0793
0.0951
0.1151 0.1131
0.02
0.2743
0.3085
0.0287 0.0281
0.0274
0.0359 0.0351 0.0344
0.0446 0.0436
0.0016
0.0024 0.0023 0.0023
0.0033 0.0032 0.0031
0.0043
0.0057
0.00
0.07
0.0003 0.0003 0.0003 0.0003 0.0003 0.0003
0.0005 0.0004 0.0004 0.0004 0.0004 0.0004
0.0006 0.0006 0.0006 0.0006 0.0006 0.0005
0.0009 0.0009 0.0008 0.0008 0.0008 0.0008
0.0013 0.0012 0.0012 0.0011 0.0011
0.0011
0.0044
0.0059
0.0078
0.0102
0.0132
0.0170
0.0217
Standard Normal Distribution
0.05
0.03
0.04
0.0526
0.0643
0.1357 0.1335 0.1314
0.1587 0.1562
0.0778
0.0934
0.1112
0.0427 0.0418
0.0516
0.0630
0.0075
0.0099
0.0129
0.0166
0.0212
0.0268
0.0336
0.0764
0.0918
0.1093
0.1841 0.1814 0.1788 0.1762
0.2119
0.2090
0.2061
0.2033
0.2420
0.2389
0.2358
0.2327
0.1292
0.1539 0.1515
0.2709 0.2676 0.2643
0.3050
0.3015
0.2981
0.3336
0.3707
0.4090
0.0041
0.0055
0.0073
0.0096
0.0125
0.0162
0.0207
0.0262
0.0329
0.0749
0.0901
0.1075
0.0256
0.0322
0.0409
0.0401
0.0505 0.0495
0.0618
0.0606
0.1271
0.1492
0.1736
0.2005
0.2296
0.2611
0.2946
0.3446
0.3409
0.3372
0.3821
0.3783
0.3745
0.4129
0.4207 0.4168
0.4602 0.4562 0.4522 0.4483 0.4443
0.4920 0.4880
0.5000
0.4960
0.4840
0.01
0.02
0.03
0.3300
0.3669
0.4052
Standard Normal Distribution Table (page 1)
0.04
1
0.0016
0.0022
0.0030
0.0040 0.0039
0.0054
0.06
0.0071
0.0069
0.0094 0.0091
0.0122
0.0119
0.0158
0.0202
0.1251
0.1469
0.1711
0.1977
0.2266
0.2578
0.2912
0.0015
0.0015
0.0014
0.0021
0.0021
0.0020
0.0029 0.0028 0.0027
0.0052 0.0051
0.0154
0.0197
0.0735 0.0721
0.0885
0.0869
0.1056 0.1038
0.0250
0.0314
0.0392
0.0485
0.0594
0.1230
0.1446
0.1685
0.1949
0.2236
0.2546
0.2877
0.3264
0.3632
0.4013
0.4404
0.4364
0.4801 0.4761
0.05
0.06
0.0068
0.0089
0.0116
0.0038 0.0037
0.0049
0.0150
0.0192
0.0244
0.0307
0.0708
0.0853
0.1020
0.1210
0.1423
0.1660
0.1922
0.2206
0.08
0.0239
0.0301
0.0384 0.0375
0.0475
0.0465
0.0582
0.0571
0.2514
0.2843
0.0003
0.0004
0.0005
0.3192
0.3557
0.0007
0.0010
0.4325
0.4721
0.07
0.0066
0.0087
0.0113
0.0146
0.0188
0.0694
0.0838
0.1003
0.1190
0.1401
0.1635
0.1894
0.2177
0.2483
0.2810
0.3228
0.3156
0.3594
0.3520
0.3974 0.3936 0.3897
0.4286
0.4681
0.08
0.09
0.0002
0.0003
0.0005
0.0007
0.0010
0.0014
0.0019
0.0026
0.0036
0.0048
0.0064
0.0084
0.0110
0.0143
0.0183
0.0233
0.0294
0.0367
0.0455
0.0559
0.0681
0.0823
0.0985
0.1170
0.1379
0.1611
0.1867
0.2148
0.2451
0.2776
0.3121
0.3483
0.3859
0.4247
0.4641
0.09
Expert Solution
This question has been solved!
Explore an expertly crafted, step-by-step solution for a thorough understanding of key concepts.

Step by step
Solved in 3 steps

Recommended textbooks for you
MATLAB: An Introduction with Applications
Statistics
ISBN:
9781119256830
Author:
Amos Gilat
Publisher:
John Wiley & Sons Inc

Probability and Statistics for Engineering and th…
Statistics
ISBN:
9781305251809
Author:
Jay L. Devore
Publisher:
Cengage Learning

Statistics for The Behavioral Sciences (MindTap C…
Statistics
ISBN:
9781305504912
Author:
Frederick J Gravetter, Larry B. Wallnau
Publisher:
Cengage Learning
MATLAB: An Introduction with Applications
Statistics
ISBN:
9781119256830
Author:
Amos Gilat
Publisher:
John Wiley & Sons Inc
Probability and Statistics for Engineering and th…
Statistics
ISBN:
9781305251809
Author:
Jay L. Devore
Publisher:
Cengage Learning
Statistics for The Behavioral Sciences (MindTap C…
Statistics
ISBN:
9781305504912
Author:
Frederick J Gravetter, Larry B. Wallnau
Publisher:
Cengage Learning

Elementary Statistics: Picturing the World (7th E…
Statistics
ISBN:
9780134683416
Author:
Ron Larson, Betsy Farber
Publisher:
PEARSON

The Basic Practice of Statistics
Statistics
ISBN:
9781319042578
Author:
David S. Moore, William I. Notz, Michael A. Fligner
Publisher:
W. H. Freeman

Introduction to the Practice of Statistics
Statistics
ISBN:
9781319013387
Author:
David S. Moore, George P. McCabe, Bruce A. Craig
Publisher:
W. H. Freeman