In a recent Gallup survey of 1,012 randomly selected U.S. adults (age 18 and over), 53% said that they were dissatisfied with the quality of education students receive in kindergarten through grade 12. They also report that the "margin of sampling error is plus or minus 4%." Find an interval estimate for the parameter of interest. Interpret it in terms of dissatisfaction in the quality of education students receive. Use two decimal places in your answer. O 0.49 to 0.57. We are 95% sure that the proportion of U.S. adults who reported being dissatisfied with the quality of education students receive in kindergarten through grade 12 is between 0.49 and 0.57 (i.e., 49% and 57%). O 0.49 to 0.57. We are 95% sure that the true proportion of U.S. adults who are dissatisfied with the quality of education students receive in kindergarten through grade 12 is between 0.49 and 0.57 (i.e., 49% and 57%). O 0.51 to 0.55. We are 95% sure that the proportion of U.S. adults who reported being dissatisfied with the quality of education students receive in kindergarten through grade 12 is between 0.51 and 0.55 (i.e., 51% and 55%). O 0.51 to 0.55. We are 95% sure that the true proportion of U.S. adults who are dissatisfied with the quality of education students receive in kindergarten through grade 12 is between 0.51 and 0.55 (i.e., 51% and 55%).
In a recent Gallup survey of 1,012 randomly selected U.S. adults (age 18 and over), 53% said that they were dissatisfied with the quality of education students receive in kindergarten through grade 12. They also report that the "margin of sampling error is plus or minus 4%." Find an interval estimate for the parameter of interest. Interpret it in terms of dissatisfaction in the quality of education students receive. Use two decimal places in your answer. O 0.49 to 0.57. We are 95% sure that the proportion of U.S. adults who reported being dissatisfied with the quality of education students receive in kindergarten through grade 12 is between 0.49 and 0.57 (i.e., 49% and 57%). O 0.49 to 0.57. We are 95% sure that the true proportion of U.S. adults who are dissatisfied with the quality of education students receive in kindergarten through grade 12 is between 0.49 and 0.57 (i.e., 49% and 57%). O 0.51 to 0.55. We are 95% sure that the proportion of U.S. adults who reported being dissatisfied with the quality of education students receive in kindergarten through grade 12 is between 0.51 and 0.55 (i.e., 51% and 55%). O 0.51 to 0.55. We are 95% sure that the true proportion of U.S. adults who are dissatisfied with the quality of education students receive in kindergarten through grade 12 is between 0.51 and 0.55 (i.e., 51% and 55%).

Glencoe Algebra 1, Student Edition, 9780079039897, 0079039898, 2018
18th Edition
ISBN:9780079039897
Author:Carter
Publisher:Carter
Chapter10: Statistics
Section10.4: Distributions Of Data
Problem 22PFA

Related questions
Question
How do you find margin of error
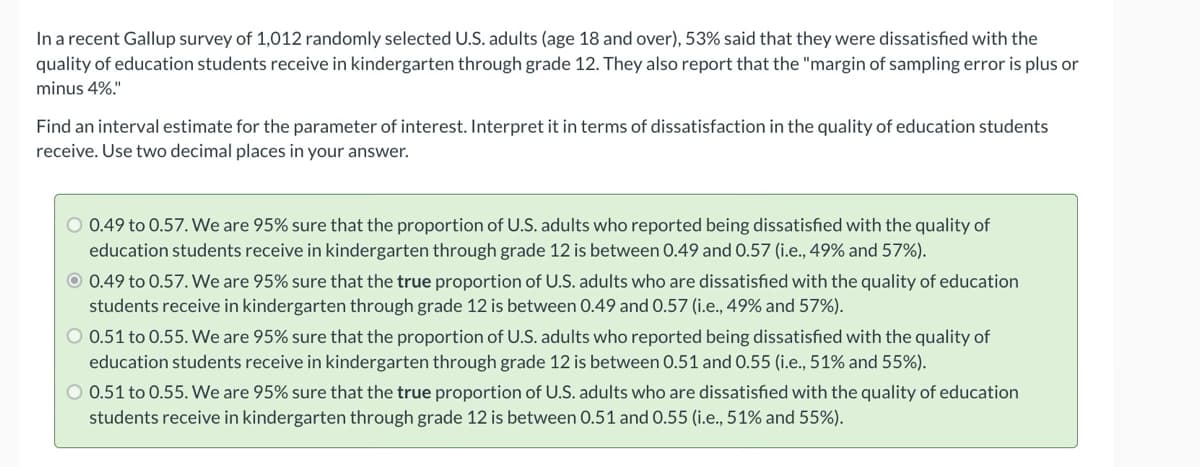
Transcribed Image Text:In a recent Gallup survey of 1,012 randomly selected U.S. adults (age 18 and over), 53% said that they were dissatisfied with the
quality of education students receive in kindergarten through grade 12. They also report that the "margin of sampling error is plus or
minus 4%."
Find an interval estimate for the parameter of interest. Interpret it in terms of dissatisfaction in the quality of education students
receive. Use two decimal places in your answer.
O 0.49 to 0.57. We are 95% sure that the proportion of U.S. adults who reported being dissatisfied with the quality of
education students receive in kindergarten through grade 12 is between 0.49 and 0.57 (i.e., 49% and 57%).
O 0.49 to 0.57. We are 95% sure that the true proportion of U.S. adults who are dissatisfied with the quality of education
students receive in kindergarten through grade 12 is between 0.49 and 0.57 (i.e., 49% and 57%).
O 0.51 to 0.55. We are 95% sure that the proportion of U.S. adults who reported being dissatisfied with the quality of
education students receive in kindergarten through grade 12 is between 0.51 and 0.55 (i.e., 51% and 55%).
O 0.51 to 0.55. We are 95% sure that the true proportion of U.S. adults who are dissatisfied with the quality of education
students receive in kindergarten through grade 12 is between 0.51 and 0.55 (i.e., 51% and 55%).
Expert Solution
This question has been solved!
Explore an expertly crafted, step-by-step solution for a thorough understanding of key concepts.

This is a popular solution!

Trending now
This is a popular solution!

Step by step
Solved in 2 steps with 2 images

Recommended textbooks for you
Glencoe Algebra 1, Student Edition, 9780079039897…
Algebra
ISBN:
9780079039897
Author:
Carter
Publisher:
McGraw Hill
Glencoe Algebra 1, Student Edition, 9780079039897…
Algebra
ISBN:
9780079039897
Author:
Carter
Publisher:
McGraw Hill