Question 8: Suppose we are interested in comparing the proportion of male students who smoke to the proportion of female students who smoke. We have a random sample of 150 students (60 males and 90 females) that includes two variables: Smoke = "ves" or "no" and Gender = "female (F)" or "male (M)." The two-way table below summarizes the results. Smoke = Yes Smoke = No Sample Size 60 Gender = M Gender = F 9. 51 9. 81 90 where pm and Pf a. If the parameter of interest is the difference in proportions, pm- pf, represent the proportion of smokers in each gender, find the difference in proportions based on the data in the table. Report your answer with two decimal places.
Question 8: Suppose we are interested in comparing the proportion of male students who smoke to the proportion of female students who smoke. We have a random sample of 150 students (60 males and 90 females) that includes two variables: Smoke = "ves" or "no" and Gender = "female (F)" or "male (M)." The two-way table below summarizes the results. Smoke = Yes Smoke = No Sample Size 60 Gender = M Gender = F 9. 51 9. 81 90 where pm and Pf a. If the parameter of interest is the difference in proportions, pm- pf, represent the proportion of smokers in each gender, find the difference in proportions based on the data in the table. Report your answer with two decimal places.

Linear Algebra: A Modern Introduction
4th Edition
ISBN:9781285463247
Author:David Poole
Publisher:David Poole
Chapter7: Distance And Approximation
Section7.3: Least Squares Approximation
Problem 31EQ

Related questions
Question
A AND B
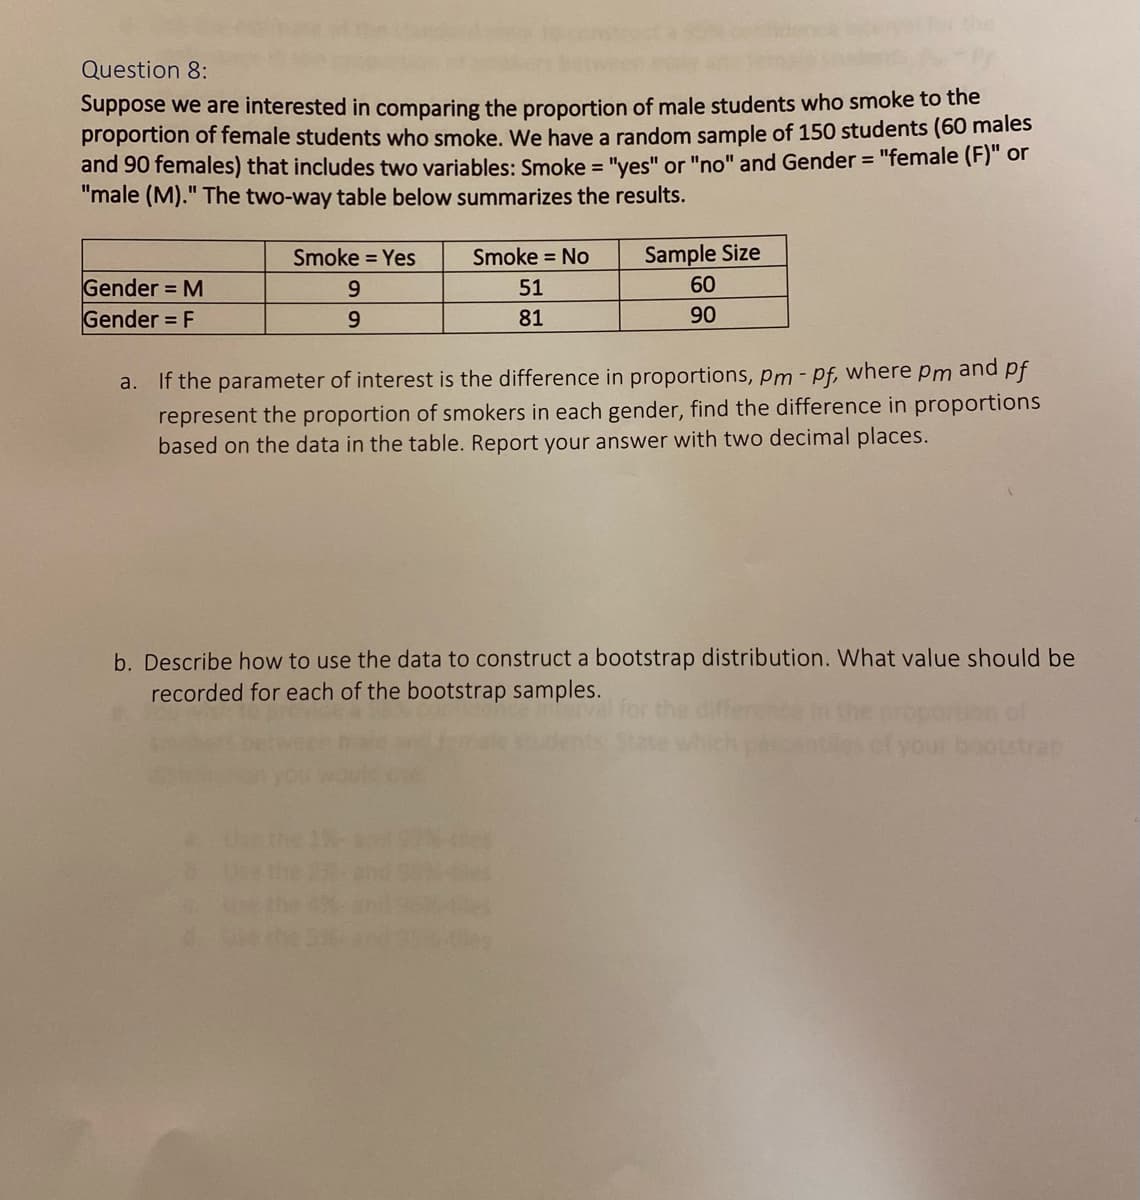
Transcribed Image Text:Question 8:
Suppose we are interested in comparing the proportion of male students who smoke to the
proportion of female students who smoke. We have a random sample of 150 students (60 males
and 90 females) that includes two variables: Smoke = "yes" or "no" and Gender = "female (F)" or
"male (M)." The two-way table below summarizes the results.
%3D
Smoke = Yes
Smoke = No
Sample Size
60
Gender = M
Gender = F
51
9.
81
90
a. If the parameter of interest is the difference in proportions, pm - pf, where pm and pf
represent the proportion of smokers in each gender, find the difference in proportions
based on the data in the table. Report your answer with two decimal places.
b. Describe how to use the data to construct a bootstrap distribution. What value should be
recorded for each of the bootstrap samples.
Expert Solution
This question has been solved!
Explore an expertly crafted, step-by-step solution for a thorough understanding of key concepts.

This is a popular solution!

Trending now
This is a popular solution!

Step by step
Solved in 2 steps

Recommended textbooks for you
Linear Algebra: A Modern Introduction
Algebra
ISBN:
9781285463247
Author:
David Poole
Publisher:
Cengage Learning

Functions and Change: A Modeling Approach to Coll…
Algebra
ISBN:
9781337111348
Author:
Bruce Crauder, Benny Evans, Alan Noell
Publisher:
Cengage Learning
Linear Algebra: A Modern Introduction
Algebra
ISBN:
9781285463247
Author:
David Poole
Publisher:
Cengage Learning
Functions and Change: A Modeling Approach to Coll…
Algebra
ISBN:
9781337111348
Author:
Bruce Crauder, Benny Evans, Alan Noell
Publisher:
Cengage Learning