In a recent study on world happiness, participants were asked to evaluate their current lives on a scale from 0 to 10, where 0 represents the worst possible life and 10 represents the best possible life. The responses were normally distributed, with a mean of 4.6 and a standard deviation of 1.9. Answer parts (a) (d) below. The probability that a randomly selected study participant's response was less than 4 is .3745. (Round to four decimal places as needed.) (b) Find the probability that a randomly selected study participant's response was between 4 and 6. The probability that a randomly selected study participant's response was between 4 and 6 is (Round to four decimal places as needed.) (c) Find the probability that a randomly selected study participant's response was more than 8. The probability that a randomly selected study participant's response was more than 8 is (Round to four decimal places as needed.) (d) Identify any unusual events. Explain your reasoning. Choose the correct answer below. O A. The event in part (c) is unusual because its probability is less than 0.05. O B. The event in part (a) is unusual because its probability is less than 0.05. O C. The events in parts (a) and (b) are unusual because their probabilities are less than 0.05. O D. None of the events are unusual because all the probabilities are greater than 0.05.
In a recent study on world happiness, participants were asked to evaluate their current lives on a scale from 0 to 10, where 0 represents the worst possible life and 10 represents the best possible life. The responses were normally distributed, with a mean of 4.6 and a standard deviation of 1.9. Answer parts (a) (d) below. The probability that a randomly selected study participant's response was less than 4 is .3745. (Round to four decimal places as needed.) (b) Find the probability that a randomly selected study participant's response was between 4 and 6. The probability that a randomly selected study participant's response was between 4 and 6 is (Round to four decimal places as needed.) (c) Find the probability that a randomly selected study participant's response was more than 8. The probability that a randomly selected study participant's response was more than 8 is (Round to four decimal places as needed.) (d) Identify any unusual events. Explain your reasoning. Choose the correct answer below. O A. The event in part (c) is unusual because its probability is less than 0.05. O B. The event in part (a) is unusual because its probability is less than 0.05. O C. The events in parts (a) and (b) are unusual because their probabilities are less than 0.05. O D. None of the events are unusual because all the probabilities are greater than 0.05.

MATLAB: An Introduction with Applications
6th Edition
ISBN:9781119256830
Author:Amos Gilat
Publisher:Amos Gilat
Chapter1: Starting With Matlab
Section: Chapter Questions
Problem 1P

Related questions

Question
In a recent study on world happiness, participants were asked to evaluate their current lives on a scale from 0 to 10, where 0 represents the worst possible life and 10 represents the best possible life. The responses were
(a) Find the probability that a randomly selected study participant's response was less than 4.
The probability that a randomly selected study participant's response was less than 4 is ___. (Round to four decimal places as needed.)
(b) Find the probability that a randomly selected study participant's response was between 4 and 6.
The probability that a randomly selected study participant's response was between 4 and 6 is ___. (Round to four decimal places as needed.)
(c) Find the probability that a randomly selected study participant's response was more than 8.
The probability that a randomly selected study participant's response was more than 8 is ___. (Round to four decimal places as needed.)
(d) Identify any unusual events. Explain your reasoning. Choose the correct answer below.
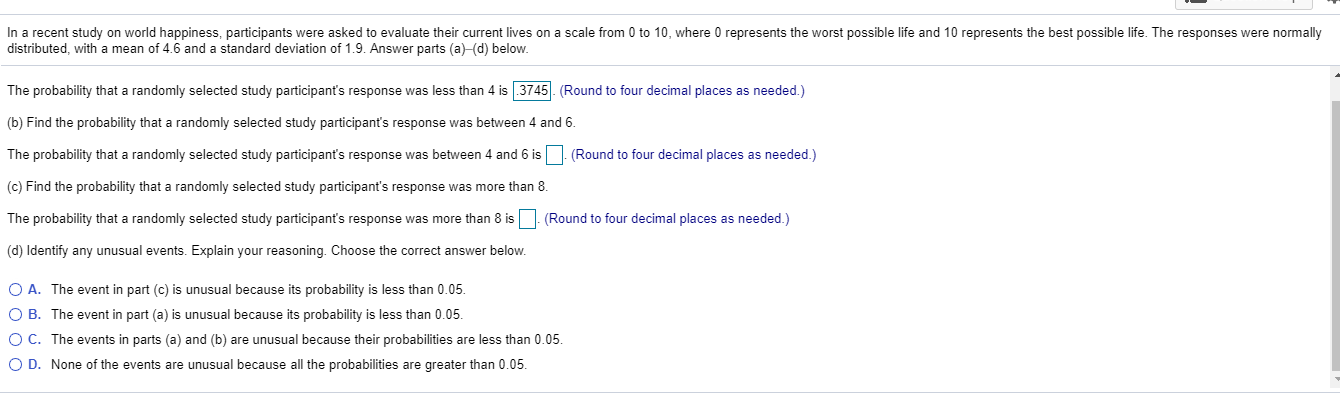
Transcribed Image Text:In a recent study on world happiness, participants were asked to evaluate their current lives on a scale from 0 to 10, where 0 represents the worst possible life and 10 represents the best possible life. The responses were normally
distributed, with a mean of 4.6 and a standard deviation of 1.9. Answer parts (a) (d) below.
The probability that a randomly selected study participant's response was less than 4 is .3745. (Round to four decimal places as needed.)
(b) Find the probability that a randomly selected study participant's response was between 4 and 6.
The probability that a randomly selected study participant's response was between 4 and 6 is
(Round to four decimal places as needed.)
(c) Find the probability that a randomly selected study participant's response was more than 8.
The probability that a randomly selected study participant's response was more than 8 is
(Round to four decimal places as needed.)
(d) Identify any unusual events. Explain your reasoning. Choose the correct answer below.
O A. The event in part (c) is unusual because its probability is less than 0.05.
O B. The event in part (a) is unusual because its probability is less than 0.05.
O C. The events in parts (a) and (b) are unusual because their probabilities are less than 0.05.
O D. None of the events are unusual because all the probabilities are greater than 0.05.
Expert Solution
This question has been solved!
Explore an expertly crafted, step-by-step solution for a thorough understanding of key concepts.

This is a popular solution!

Trending now
This is a popular solution!

Step by step
Solved in 5 steps with 3 images

Knowledge Booster


Learn more about
Need a deep-dive on the concept behind this application? Look no further. Learn more about this topic, statistics and related others by exploring similar questions and additional content below.Recommended textbooks for you
MATLAB: An Introduction with Applications
Statistics
ISBN:
9781119256830
Author:
Amos Gilat
Publisher:
John Wiley & Sons Inc

Probability and Statistics for Engineering and th…
Statistics
ISBN:
9781305251809
Author:
Jay L. Devore
Publisher:
Cengage Learning

Statistics for The Behavioral Sciences (MindTap C…
Statistics
ISBN:
9781305504912
Author:
Frederick J Gravetter, Larry B. Wallnau
Publisher:
Cengage Learning
MATLAB: An Introduction with Applications
Statistics
ISBN:
9781119256830
Author:
Amos Gilat
Publisher:
John Wiley & Sons Inc
Probability and Statistics for Engineering and th…
Statistics
ISBN:
9781305251809
Author:
Jay L. Devore
Publisher:
Cengage Learning
Statistics for The Behavioral Sciences (MindTap C…
Statistics
ISBN:
9781305504912
Author:
Frederick J Gravetter, Larry B. Wallnau
Publisher:
Cengage Learning

Elementary Statistics: Picturing the World (7th E…
Statistics
ISBN:
9780134683416
Author:
Ron Larson, Betsy Farber
Publisher:
PEARSON

The Basic Practice of Statistics
Statistics
ISBN:
9781319042578
Author:
David S. Moore, William I. Notz, Michael A. Fligner
Publisher:
W. H. Freeman

Introduction to the Practice of Statistics
Statistics
ISBN:
9781319013387
Author:
David S. Moore, George P. McCabe, Bruce A. Craig
Publisher:
W. H. Freeman