In a regression based on 30 annual observations, U.S. farm income was related to four in- dependent variables-grain exports, federal government subsidies, population, and a dummy variable for bad weather years. The model was fitted by least squares, resulting in a Durbin- Watson statistic of 1.29. The regression of e? on ŷ; yielded a coefficient of determination of 0.043. (a) Test for heteroscedasticity. (b) Test for autocorrelated errors.
In a regression based on 30 annual observations, U.S. farm income was related to four in- dependent variables-grain exports, federal government subsidies, population, and a dummy variable for bad weather years. The model was fitted by least squares, resulting in a Durbin- Watson statistic of 1.29. The regression of e? on ŷ; yielded a coefficient of determination of 0.043. (a) Test for heteroscedasticity. (b) Test for autocorrelated errors.

Linear Algebra: A Modern Introduction
4th Edition
ISBN:9781285463247
Author:David Poole
Publisher:David Poole
Chapter7: Distance And Approximation
Section7.3: Least Squares Approximation
Problem 31EQ

Related questions
Question
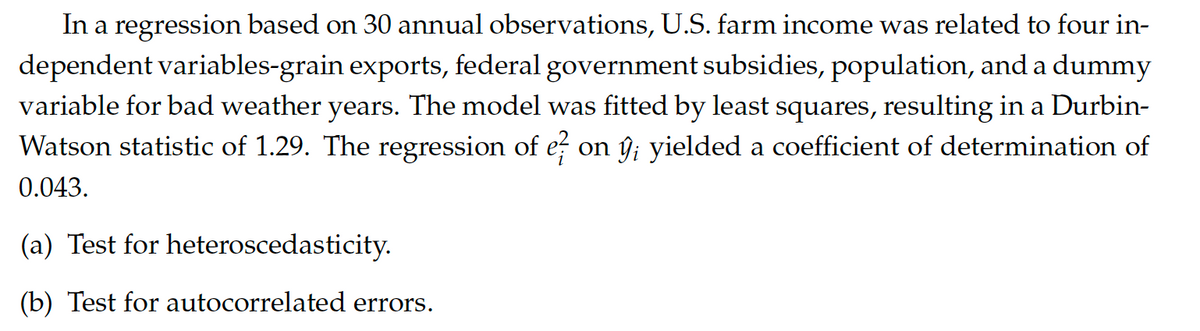
Transcribed Image Text:In a regression based on 30 annual observations, U.S. farm income was related to four in-
dependent variables-grain exports, federal government subsidies, population, and a dummy
variable for bad weather years. The model was fitted by least squares, resulting in a Durbin-
Watson statistic of 1.29. The regression of e on ŷ yielded a coefficient of determination of
0.043.
(a) Test for heteroscedasticity.
(b) Test for autocorrelated errors.
Expert Solution
This question has been solved!
Explore an expertly crafted, step-by-step solution for a thorough understanding of key concepts.

This is a popular solution!

Trending now
This is a popular solution!

Step by step
Solved in 3 steps

Recommended textbooks for you
Linear Algebra: A Modern Introduction
Algebra
ISBN:
9781285463247
Author:
David Poole
Publisher:
Cengage Learning
Linear Algebra: A Modern Introduction
Algebra
ISBN:
9781285463247
Author:
David Poole
Publisher:
Cengage Learning