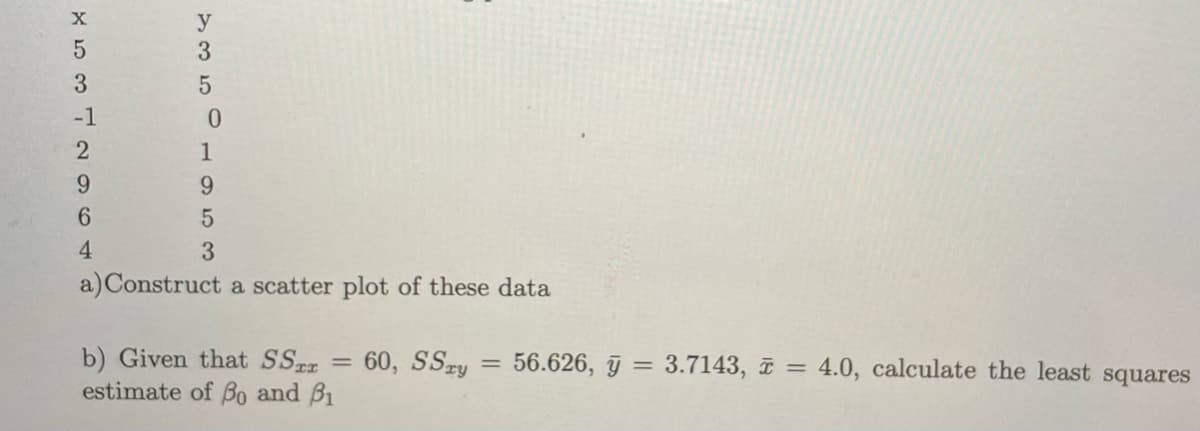
5 3 -1 2 135 y 0 1 9 5 3 9 6 4 a) Construct a scatter plot of these data b) Given that SST estimate of Bo and Bi 60, SSzy = 56.626, y = = 3.7143, x = 4.0, calculate the least squa


Q: 52% of U.S. adults have very little confidence in newspapers. You randomly select 10 U.S. adults.…
A: Answer:- Given, 52% of U.S. adults have very little confidence in newspaper. i.e P = 0.52…
Q: A quality control supervisor inspects a production of 35 computer chips, 5 of which are defective.…
A: In this case, it may be interpreted that, each chip has the only options of being "defective" (i.e.,…
Q: The following table shows the number of hours spent for studying and the grade obtained by a student…
A: X Y X.Y X2 Y2 1.5 85 127.5 2.25 7225 2 85 170 4 7225 4 95 380 16 9025 2 87 174 4 7569…
Q: You must estimate the mean temperature (in degrees Fahrenheit) with the following sample…
A:
Q: If the p-value is less than or equal to a,we reject the alternative hypothesis (p ≤ a) answer
A: The given statement is p-value ≤ α
Q: Identify the sampling technique used. Every fifth person boarding a plane is searched thoroughly.
A: here use basic of sampling method there are various sampling methods like , systematic , stratified…
Q: A radio shop sells, on an average, 200 radios per day with a standard deviation of 50radios. After…
A: Given that: Population mean, μ=200 Population standard deviation, σ=50 Sample size, n = 50 Sample…
Q: A laundry shop averages 9 customers per hour. Assume that the number of customers is a Poisson…
A:
Q: A sample of the length in inches for newborns is given below. Assume that lengths are normally…
A:
Q: suppose you want to estimate the proportion of those who passed the subject (grade ≥ 75). How large…
A: Given:Relative error=10%Risk factor=15%Find:Sample size?
Q: It is found that a sample of size 100 yields 8 defective items. a. What is the best point estimate…
A: Given data: n = 100 x = 8
Q: A population has a mean μ = 142 and a standard deviation o=25. Find the mean and standard deviation…
A:
Q: What are the two decisions that you can make from performing a hypothesis test?
A: here use basic of hypothesis testing , In hypothesis Testing the result is either in favor of Claim…
Q: 1. A random variable that can be used to find a 95% confidence interval for μ₁-₂ is
A: Given μ1 -μ2
Q: An oceanographer claims that the mean dive duration of a North Atlantic right whale is 11.7 minutes.…
A: GivenMean(x)=12.4standard deviation(s)=2.2sample size(n)=33α=0.01
Q: (a) Using a weight of for the most recent observation, for the second most recent observation, and…
A: The question is about forecasting Given :
Q: After the premiere of the new comedy Bumblebee, moviegoers were asked in a quick poll whether they…
A: It is given that, out of 25 adults,16 said they liked the movie, whereas out of 50 teenagers, 39…
Q: The probabilities of events A, B, and An B are given. Find (a) P(A U B), (b) the odds in favor of…
A: Since you have posted a question with multiple sub-parts, we will first 3 sub-parts for you. To get…
Q: student in each of his 6 subjects during the last grading period. What is the slope of the estimated…
A:
Q: There are two types of variables – categorical and numerical, sometimes referred to as qualitative…
A: From the given information, there are two variables, categorical and numerical variables. Here,…
Q: na batch of 23 pedometers, 3 are believed to be defective. A quality-control engineer randomly…
A: Given Information: There are 23 pedometers Among which 3 are defective. A random sample of 7 units…
Q: Question 8 A research firm wants to estimate, within 3 percent, the proportion of junior executives…
A: Question 8: Given Information: Margin of error E=±3% i.e., 0.03 Confidence level is 95% Percent of…
Q: In the context of global alignment (scores: match = 6, mismatch = -2, and gap = -2), what will be…
A: Solution Given
Q: 1 Given that P(A or B) = —, P(A) = =, and P(A and B)=, find P(B). O A. 77 360 11 O B. 180 67 OC. 360…
A: Given;P(A or B)=15P(A)=18P(A and B)=19
Q: A study was conducted to determine the proportion of people who dream in black and white instead of…
A: (b) Obtain the 98% confidence interval for the difference between two proportions. The 98%…
Q: A random variable that can be used of the gamma distribution is
A: Random variable can be α=4,β Mean and variance can be, E(X)=αβ=4βVar(X)=αβ2=4β2 Size of sample is…
Q: The total of individual weights of garbage discarded by 16 households in one week is normally…
A: Obtain the 99% confidence interval of the population mean. The 99% confidence interval of the…
Q: Pedro has just entered university and has been informed that there is a 30% chance of receiving a…
A: Given that Pedro has just entered university and has been informed that there is a 30% chance of…
Q: A study of emergency service facilities investigated the relationship between the number of…
A: When we want to predict the value of one variable, say y, from the given value of another variable,…
Q: Is there any systematic tendency for part-time college faculty to hold their students to different…
A: Given, We assume 1 as fulltime faculty; We assume 2 as part timers; Significance level,
Q: The accompanying table provides data for tar, nicotine, and carbon monoxide (CO) contents in a…
A: The given data indicates tar, nicotine, and carbon monoxide contents in a certain brand of…
Q: Information regarding the price of a roll of camera film (35 mm, 24 exposure) for a sample of 13…
A: From the provided information, Sample size (n) = 13 Sample mean (x̄) = 4.9846 Standard error (SE) =…
Q: A recent survey found that 70% of all adults over 50 wear glasses for driving. In a random sample of…
A: A random variable x is following the binomial distribution with the following probability mass…
Q: A machine gun shoots for 3 seconds at the rate of 2400 bullets/minute. The probability of a bullet…
A:
Q: Assume that the readings at freezing on a batch of thermometers are normally distributed with a mean…
A:
Q: Which one of the following statements is true about Nonparametric techniques? A.they are harder to…
A: Given a parametric and nonparametric test
Q: ssume that a sample is used to estimate a population proportion p. Find the margin of error M.E.…
A: The following information has been given: The sample size is n=275. The sample proportion is…
Q: Use the given information to find the minimum sample size required to estimate an unknown population…
A:
Q: The total of individual weights of garbage discarded by 15 households in one week is normally…
A: The total of individual weights discarded by 15 households is normally distributed with mean 29.7…
Q: Let event G = taking a math class. Let event H = taking a science class. Then, G ∩ H = taking a math…
A:
Q: Q4/B - A factory for the production of electric lamps, consisting of 12 identical machines.…
A: Number of machines(N)=12 Number of samples(n)=4
Q: 5
A: The dependent t-test (called the paired-samples t-test) compares the means between two related…
Q: The unemployment rate in a city is 13%. If 6 people from the city are sampled at random, find the…
A:
Q: Francis wants to donate his 15 books to his three friends. If he gives 7 books to one of his friend,…
A: You have 15 books. 7 to one friend 5 to other friend And 3 to third friend. No. Of ways to do this…
Q: Suppose a study of speeding violations and drivers who use cell phones produced the following data:…
A: speeding violation no speeding violation total use cell phone 50 295 345 not use cell phone 60…
Q: variane of population to 10, 12, 13, 14, 17 equal I need answer within 3 minutes with my best wishes…
A: Given data is ,10, 12, 13, 14, 17sample size(n)=5mean(x¯)=10+12+13+14+175mean(x¯)=665mean(x¯)=13.2
Q: The mode of 0 123456789 34 I need answer within 3 minutes with my best wishes ton .A 3 .B 4 .C 4 & 3
A: The given data is 0.0, 1.0, 2.0, 3.0, 3.0, 4.0, 4.0, 5.0, 6.0, 7.0, 8.0, 9.0
Q: tate whether the variable is discrete or continuous. he blood pressures of a group of students the…
A: Discrete variable: The discrete variable is the variable that considers the countable number of…
Q: 24. X= 48.90-46.78 a 7 n=13* O a.-3.937 Ob. 3.937 O c. -1.092 O d. 1.092 25. x=234.56=233.45 3.7 n =…
A:
Q: 6. If the variance of grades in an Economics course is 25, each student should unconditionally…
A: Given that: The variance of grades in an Economics course is 25.

Step by step
Solved in 2 steps with 2 images

- Design a 3rd order Least-squares function approximation to interpolate between the mid between (2n and 3") for a dataset as chosen by you. Compute the LS model error.The article “Characterization of Highway Runoff in Austin, Texas, Area” (J. of Envir. Engr., 1998: 131–137) gave a scatterplot, along with the least squares line, of x = rainfall volume (m3) and y = runoff volume (m3) for a particular location. The accompanying values were read from the plot. x <‐ c(5, 12, 14, 17, 23, 30, 40, 47, 55, 67, 72, 81, 96, 112, 127) y <‐ c(4, 10, 13, 15, 15, 25, 27, 46, 38, 46, 53, 70, 82, 99, 100) Test at level 0.05 whether there is a useful linear relationship between rainfall and runoff,and then calculate a 95% confidence interval for the true average change in runoff volumeassociated with one unit (one m3) increase in rainfall volume.Compute the sum-of-squares error (SSE) by hand for the given set of data and linear model. (8, 10), (9, 11), (16, 20), (12, 2); y = 2x − 8
- Calculate Pearson’s coefficient of skewness. Hence, describe the shape of thedistribution of the waiting time for counter A and B.The following table shows the percent of water and the number of calories in various canned soups to which 100 g of water are added. (show all the necessary solution) Percent Water in Soups % Water Calories 83.3 28 92.3 26 91.9 39 89.4 57 89.5 57 90.5 36 91.9 32 91.7 32 a. Find the equation of the least squares line for the data. b. Use the equation in part a to find the expected number of calories in a soup that is 87% water. c. Determine the correlation coefficient of the data.An experiment was conducted to assess the effect of baking temperature on the density of bread. A large batch ofwhite bread dough and a large batch of whole wheat bread dough were prepared. Each of the batches was formedinto loaves, resulting in a total of loaves. Each of the white bread loaves was randomly assigned to one ofthree baking temperatures (low, medium, and high), so that loaves were baked at the low temperature, werebaked at the medium temperature, and were baked at the high temperature. A similar process of randomassignment was carried out for the whole wheat bread loaves.Which of the following are the treatments in the experiment? (A) The loaves of bread(B) The type of bread (white, whole wheat)(C) The density of the bread(D) The baking temperatures (low, medium, high)(E) The two batches of bread dough
- A least squares line for a sample with 11 observations has an SSE = 192; calculate and s. Please show your work So i can understand how you arrived at the answerDr. Dommer is interested in testing whether the gender breakdown in his introductory biology class isrepresentative of the gender breakdown of the college population. There are 20 females and 25 males in his class. If the college population is 60 percent female, what should Dr. Dommer conclude about the representativeness of his class? Complete the 6 steps of hypothesis testing. Show your work for each step. Report your results and conclusion in APA style. Assume that alpha is set at .05.J 2 make a 2 way ANOVA table for data on MATLAB with code
- Consider the performance function of a structural element Z =R-S , where R and S are normal random variables in the image. Calculate the failure probability of the element.The shape of the mean-variance frontier that results from the combination of a riskless and arisky asset is…..:a. Is U-shaped, tilted 90 degrees clockwise.b. Is a straight line passing from the mean-variance points of the two assets.c. Is a hyperbola.d. Consists of two straight lines, each connecting one of the two assets to a risk-freeportfolioIn Austria ,The amount of money spent on the restoration of a sanctuary and the distinct kangaroo populations present appeared to have negative correlations For investigation of this onserved assocaition ,what can a resecher do to begin his research 1Conduct an experiment 2Calculate the squares of coreealtion coefficient 3Calculate the least squares regression line 4 calculate the corelation coefficient Explain answer in 1 or 2 lines
