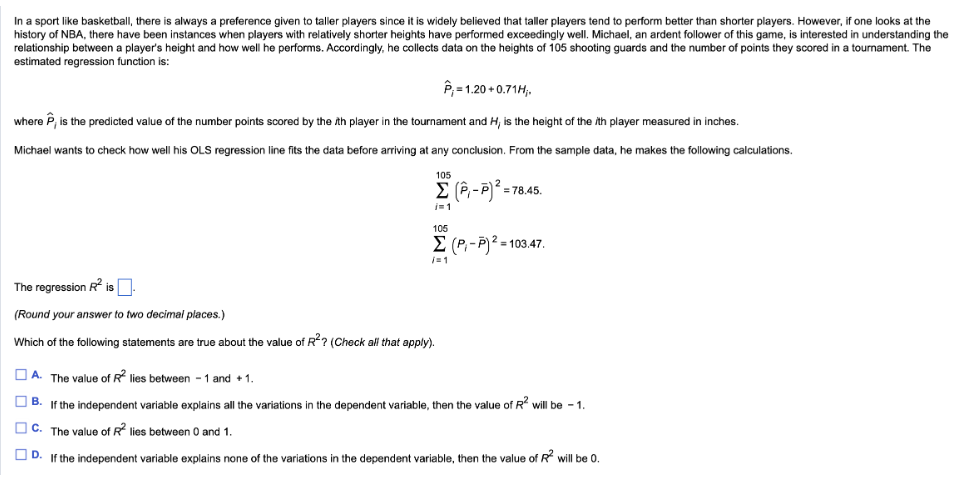
In a sport like basketball, there is always a preference given to taller players since it is widely believed that taller players tend to perform better than shorter players. However, if one looks at the history of NBA, there have been instances when players with relatively shorter heights have performed exceedingly well. Michael, an ardent follower of this game, is interested in understanding the relationship between a player's height and how well he performs. Accordingly, he collects data on the heights of 105 shooting guards and the number of points they scored in a tournament. The estimated regression function is: P₁=1.20+0.71H;. where P, is the predicted value of the number points scored by the ith player in the tournament and H, is the height of the ith player measured in inches. Michael wants to check how well his OLS regression line fits the data before arriving at any conclusion. From the sample data, he makes the following calculations. 105 Σ (P₁-P)² = 78.45. i=1 105 Σ (P₁-P)²=103.47. /=1 The regression R² is (Round your answer to two decimal places.) Which of the following statements are true about the value of R²? (Check all that apply). A. The value of R² lies between - 1 and +1. B. If the independent variable explains all the variations in the dependent variable, then the value of R² will be -1. C. The value of R² lies between 0 and 1. D. If the independent variable explains none of the variations in the dependent variable, then the value of R² will be 0.
In a sport like basketball, there is always a preference given to taller players since it is widely believed that taller players tend to perform better than shorter players. However, if one looks at the history of NBA, there have been instances when players with relatively shorter heights have performed exceedingly well. Michael, an ardent follower of this game, is interested in understanding the relationship between a player's height and how well he performs. Accordingly, he collects data on the heights of 105 shooting guards and the number of points they scored in a tournament. The estimated regression function is: P₁=1.20+0.71H;. where P, is the predicted value of the number points scored by the ith player in the tournament and H, is the height of the ith player measured in inches. Michael wants to check how well his OLS regression line fits the data before arriving at any conclusion. From the sample data, he makes the following calculations. 105 Σ (P₁-P)² = 78.45. i=1 105 Σ (P₁-P)²=103.47. /=1 The regression R² is (Round your answer to two decimal places.) Which of the following statements are true about the value of R²? (Check all that apply). A. The value of R² lies between - 1 and +1. B. If the independent variable explains all the variations in the dependent variable, then the value of R² will be -1. C. The value of R² lies between 0 and 1. D. If the independent variable explains none of the variations in the dependent variable, then the value of R² will be 0.

Glencoe Algebra 1, Student Edition, 9780079039897, 0079039898, 2018
18th Edition
ISBN:9780079039897
Author:Carter
Publisher:Carter
Chapter10: Statistics
Section: Chapter Questions
Problem 13PT

Related questions
Question
am. 330.
Transcribed Image Text:In a sport like basketball, there is always a preference given to taller players since it is widely believed that taller players tend to perform better than shorter players. However, if one looks at the
history of NBA, there have been instances when players with relatively shorter heights have performed exceedingly well. Michael, an ardent follower of this game, is interested in understanding the
relationship between a player's height and how well he performs. Accordingly, he collects data on the heights of 105 shooting guards and the number of points they scored in a tournament. The
estimated regression function is:
P₁ = 1.20 +0.71H;.
where P, is the predicted value of the number points scored by the th player in the tournament and H, is the height of the th player measured in inches.
Michael wants to check how well his OLS regression line fits the data before arriving at any conclusion. From the sample data, he makes the following calculations.
105
Σ (-7)2 =1
i=1
= 78.45.
105
Σ (P - P)2 = 103.47.
/=1
The regression R² is
(Round your answer to two decimal places.)
Which of the following statements are true about the value of R²? (Check all that apply).
ΠΑ The value of R² lies between 1 and +1.
B. If the independent variable explains all the variations in the dependent variable, then the value of R² will be 1.
C. The value of R² lies between 0 and 1.
D. If the independent variable explains none of the variations in the dependent variable, then the value of R² will be 0.
Expert Solution
This question has been solved!
Explore an expertly crafted, step-by-step solution for a thorough understanding of key concepts.

This is a popular solution!

Trending now
This is a popular solution!

Step by step
Solved in 4 steps with 18 images

Recommended textbooks for you
Glencoe Algebra 1, Student Edition, 9780079039897…
Algebra
ISBN:
9780079039897
Author:
Carter
Publisher:
McGraw Hill

Holt Mcdougal Larson Pre-algebra: Student Edition…
Algebra
ISBN:
9780547587776
Author:
HOLT MCDOUGAL
Publisher:
HOLT MCDOUGAL

College Algebra (MindTap Course List)
Algebra
ISBN:
9781305652231
Author:
R. David Gustafson, Jeff Hughes
Publisher:
Cengage Learning
Glencoe Algebra 1, Student Edition, 9780079039897…
Algebra
ISBN:
9780079039897
Author:
Carter
Publisher:
McGraw Hill
Holt Mcdougal Larson Pre-algebra: Student Edition…
Algebra
ISBN:
9780547587776
Author:
HOLT MCDOUGAL
Publisher:
HOLT MCDOUGAL
College Algebra (MindTap Course List)
Algebra
ISBN:
9781305652231
Author:
R. David Gustafson, Jeff Hughes
Publisher:
Cengage Learning