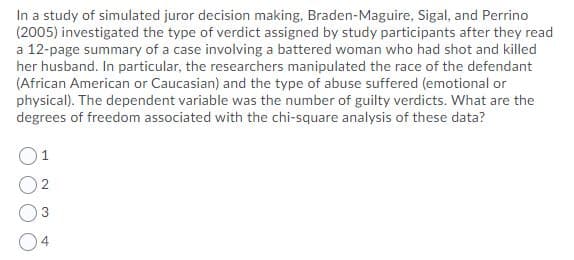
In a study of simulated juror decision making. Braden-Maguire, Sigal, and Perrino (2005) investigated the type of verdict assigned by study participants after they read a 12-page summary of a case involving a battered woman who had shot and killed her husband. In particular, the researchers manipulated the race of the defendant (African American or Caucasian) and the type of abuse suffered (emotional or physical). The dependent variable was the number of guilty verdicts. What are the degrees of freedom associated with the chi-square analysis of these data?
Q: Big Rock is listed on the local stock exchange and its stock has had mixed performance over the last...
A: The objective is to find arithmetic and geometric mean over the three-year period COMPANY initial...
Q: The federal government recently granted funds for a special program designed to reduce crime in high...
A:
Q: A Researcher Studying The Relationship Between Maternal Age And Length Of Breastfeeding In A Sample ...
A: Given Information: Sample Size (N)=75 Correlation r=0.19α=0.05
Q: (a) Probability that a consumer recycles beverage bottles. (Round your answer to 4 decimal places.) ...
A: Cycyfvvb
Q: A synthetic fiber used in manufacturing carpet has tensile strength that is normally distributed wit...
A: From the provided information, Mean (µ) = 75.5 Standard deviation (σ) = 3.5 X~N (75.5, 3.5)
Q: In a city, weekly observations were made in a study on the living index of families. NOTE: the maxim...
A: To create box and Whiskers plot in Excel we enter the data into excel sheet. Highlight the data, an...
Q: 4. In a poll of 1018 adults, it was found that 22% smoked cigarettes in the past week. Use a 0.05 si...
A:
Q: 0Y find The Sample space for The experiment.of throwing a Pink dice chce and define The Qlent E with...
A: A sample space is denoted with (S) and it is the collection of set of all possible outcomes of a ran...
Q: You decided to test the other two classes of grade 2 students, to see if you could achieve the same ...
A: The given information is The level of significance α=0.05 The calculated F value in the given ANOVA ...
Q: The average THC content of marijuana sold on the street is 10.1%. Suppose the THC content is normall...
A:
Q: A person records the speeds of various cars as they drive past their house. After 100 readings, the ...
A: Given,mean(μ)=23.84standard deviation(σ)=3.56
Q: Consider the weighted voting system {20: 19, 8, 5, 4, 3}. Are there any players that are dictators, ...
A: Weighted voting:
Q: Consider only the Midwest region when answering these questions. Express each decimal rounded to the...
A: a) The total population for the under-15 year-olds of the Midwest region is, Population=Uder 5 years...
Q: have computed the statistics of both groups of students in a class, in which they are male and femal...
A: *Answer:
Q: Lecture(10.2): The Peabody Picture Vocabulary Test has a standard score population mean of 100 and ...
A:
Q: itemB4] (refer to the photo below) Look at Curve A. Notice that it levels off between the ages of 20...
A: logistic growth In logistic growth, population expansion decreases as resources become scarc...
Q: Combined test scores were normally distributed with mean 1499 and standard deviation 348. Find the c...
A: Hence, the 20th percentile is about 1206 .
Q: Gohan throws a fair tetrahedral die with faces numbered 1, 2, 3, 4. If she throws an even number the...
A:
Q: Use the following table: Courses Credits Grade Computer Principles 4 A Business Law 2 B L...
A: Given information- We have to find the student's grade-point average (GPA) for that term. Now, cred...
Q: Assume that military aircraft use ejection seats designed for men weighing between 145.4 lb and 203 ...
A:
Q: X = 0 2 3 4 Y =1 1/32 1/32 1/32 1/16 3 1/32 1/32 1/16 1/16 4 1/32 1/16 1/16 1/16 5 1/16 1/16 1/8 3/1...
A: Given , the joint distribution of X and Y is , x = 0 2 3 4 Y = 1 1/32 1/32 1/32 1/16 3 1/3...
Q: 2. Historically, TOSHAMSONY, a manufacturer of LED TV sets is making the following percentage of its...
A: Chi-square test : The chi-square check could be a hypothesis check accustomed verify whether or not ...
Q: Insurance companies make bets. They bet that you’re going to live a long life. An insurance company ...
A: GivenDeath policy:-Mean(μ)=10000standard deviation(σ)=1000Disability policy:-Mean(μ)=5000standard de...
Q: plywood plant, the company makes plywood used in residential and commercial building. One product ma...
A: Given Pop. mean, μ=0.375Pop. sd, σ=0.05Sample size, n=100Sample mean, x¯=0.378
Q: A random-number generator simulates realizations from a Unif(0, 1) distribution. (a). distribution. ...
A: The realizations from a Unif(0,1) simulator is nothing but set of random sample following uniform di...
Q: The percentage of adults who are men and alcoholics is 2.25 percent. What is the probability of bein...
A:
Q: State whether the standardized test statistic t indicates that you should reject the null hypothesis...
A: According to the given information in this question a) t = 1.584 and the critical value is given 1.5...
Q: The President of the Farmers Association wants to know how the amount of fertilizer and the amount o...
A: Solution: Given information: n= 15 observation k= 2 independent variables MSR = 766.301 MSE = 37....
Q: Problems 1. Two discrete random variables X and Y have joint pmf given by the following table: Y 3. ...
A:
Q: Jsing Chebyshev's theorem, solve these roblems for a distribution with a mean of 80 and a standard l...
A:
Q: Kyle's doctor told him that the z-score for his systolic blood pressure is 1.75. Which of the follow...
A:
Q: Random variables X and Y have the joint density function (x+0.5y). 0<x<2,0<y<3. f (x, y) = { 43 alog...
A: Given density function is, fx,y=243x+0.5y2, 0<x<2, 0<y<3 a) If E(XY)=E(X)*E(Y), then X a...
Q: Let’s return to the model of iPod prices on eBay that was developed in Exercise 7 in Chapter 3. Tha...
A: From the given information, The regression equation is, PRICEi = 109.24 + 54.99NEWi - 20.44SCRATCHi ...
Q: Is the difference between the mean annual salaries of registered nurses in State A and State B equal...
A:
Q: X = 0 2 3 4 Y = 1 1/32 1/32 1/32 1/16 3 1/32 1/32 1/16 1/16 4 1/32 1/16 1/16 1/16 5 1/16 1/16 1/8 3/...
A: Given: X=0 2 3 4 Y=1 132 132 132 116 3 132 132 116 116 4 132 116 116 116 5 116 116 18 3...
Q: Perform a t-test (significance level a = 0.05) to test your null hypothesis and compare diastolic bl...
A: Disclaimer : Since you have asked multiple question, we will solve the first question for you. If yo...
Q: Assume that the readings on the thermometers are normally distributed with a mean of 0" and standard...
A:
Q: Women, white in USA, 1939-1941 Women in India 1921-1938 Theore tical population with haif-life of 18...
A: Here a graph mentioned. 4 curves shows life expectancy We have to tell who has a better chance of su...
Q: The length of a movie file that is available for streaming is modeled using the normal distribution ...
A:
Q: Suppose the lengths of the pregnancies of a certain animal are approximately normally distributed wi...
A: Here is given that, mean is 286 and standard deviation is 23 We will use z-standard normal distribu...
Q: Five samples of 15 minerals are taken from a population. The sample means for hardness of the minera...
A: Considering the population (i.e., the hardness of the minerals in this case) is distributed normally...
Q: 1. A die is rolled 15 times. Let X be the number of rolls in which we see a 5. a. What is the probab...
A: As per our guidelines we are supposed to answer only 3 sub-parts of any question so I am solving fir...
Q: nfamilies with five children, find the mean number of children who will be girls. Show the probabili...
A: Given: there are 5 children in family
Q: justration 8.1. Represent the following data by line charts: TABLE 8.2. PROGRESS OF ELECTRICITY SUPP...
A:
Q: АCTIVITY Measure of Central Tendency General Direction: Show your complete solution for the computat...
A: As per the Bartleby guildlines we have to solve first question....... Given that We have to find...
Q: used car deales finds that in any day, the probability of selling no car is 0.4, one car is 0.2, Two...
A: Given that Probability mass function of X is x 0 1 2 3 4 5 6 P(X=x) 0.4 0.2 0.15 0.10 0.08 0....
Q: What is the percentile rank of the participant’s Adventure Seeking trait? What percentage of the par...
A: here as per policy i have calculated 3 subparts plz repost for remaining Trait Mean Standar...
Q: For a hypothesis test of a single population proportion, we can use the "Statistics" tab in the Prob...
A: From the given information, the value of x is 5 and the value of n is 16.
Q: You wish to test the following claim (Ha) at a significance level of α=0.005 Ho:μ1=μ2 H...
A: There are 2 independent samples which follows normal distribution. We have to test whether the first...
Q: D F Suppose that a popular museum is interested in estimating the average age of summer visitors. A ...
A: Here is given that, mean is 38.3125 standard deviation is 13.4199 And sample number is 32. We will u...
5
Trending now
This is a popular solution!
Step by step
Solved in 2 steps
- Stephens, atkins, and Kingston, 2009 conducted an experiment in which participants were able to tolerate moore pain when they were shouting their favorite swear word than when they were shouting neutral words, Identify the dependent and independent variables for this studyThe Behavioral Risk Factor Surveillance System (BRFSS) is an annual telephone survey designed to identify risk factors in the adult population and reportemerging health trends. The following table summarizes two variables for the respondents: health status and health coverage, which describes whether each respondent had health insurance: Health Status Excellent Very Good Good Fair Poor Total Health No 459 727 854 385 99 2524 Coverage Yes 4198 6245 4821 1634 578 17476 Total 4657 6972 5675 2019 677 20000 If we draw one individual at random, what is the probability that the respondent has health coverage if they have good health? Answer with a decimal rounded to 3 decimal places.In a study of the effects of mood on evaluation of nutritious food, 208 subjects were randomly assigned to read either a happy story (to induce a positive mood) or a control (no story, neutral mood) group. Subjects were then asked to evaluate their attitude toward a certain food on a nine-point scale, with higher numbers indicating a more positive attitude toward the food. The following table summarizes data on the attitude rating: Group n S Positive mood 104 4.25 2.05 Neutral mood 104 5.65 1.75 Based on the evidence could we conclude that mood changes attitudes towards food? (test hypotheses at level alpha =0.05).
- In a study of the effect of handedness on athletic ability, participants were divided into three groups: right-handed, left-handed, and ambidextrous. Athletic ability was measured on a 12-point scale. The independent variable is _________; the number of levels of the independent variable is _______. 1. athletic ability; twelve 2. athletic ability; three 3. handedness; three 4. handedness; twelveA U.S. study published in The American Journal of Preventive Medicine compared state-level prevalence of firearm ownership in 2002 with state-level rates of firearm assault and firearm robbery in the subsequent year. The investigators found a positive association - meaning that states with higher prevalence of firearm ownership also tended to be the states with higher rates of firearm assault. Which design best describes this study? a)Observational cohort study b)Randomized trial c)Case-control study d)Ecological studyIn studies examining the effect of humor on interpersonal attractions, McGee and Shevlin (2009) found that an individual’s sense of humor had a significant effect on how the individual was perceived by others. In one part of the study, female college students were given brief descriptions of a potential romantic partner. The fictitious male was described positively as being single and ambitious and having good job prospects. For one group of participants, the description also said that he had a great sense of humor. For another group, it said that he has no sense of humor. After reading the description, each participant was asked to rate the attractiveness of the man on a seven-point scale from 1 (very unattractive) to 7 (very attractive). A score of 4 indicates a neutral rating. The females who read the “great sense of humor” description gave the potential partner an average attractiveness score of M = 4.53 with a standard deviation of s = 1.04. If the sample consisted of n = 16…
- When conducting a study with data that is in some way dependent, such as putting the same group of participants through both levels of the dependent variable, researchers use a _____________ design. Question 1 options: Blocked Within-subjects Independent-Samples CircularA cross-sectional study is conducted to investigate cardiovascular disease (CVD) risk factors among a sample of patients seeking medical care at one of three local hospitals. A total of 500500 patients are enrolled. Based on the following data, we would like to determine if there is a significant association between the family history of CVD and the enrollment site. Enrollment Site Family History of CVD Hospital 1 Hospital 2 Hospital 3 Total Yes 34 8 58 100 No 104 72 224 400 Total 138 80 282 500 Given: The value of the test statistic is χ2= 6.912 Use α=0.1 as the level of significance. The superintendent of Hospital 2 performed the Goodness of Fit Test to test whether 25% of the patients go to Hospital 1, 15% of the patients go to Hospital 2 and 60% of the patients go to Hospital 3. Given: The superintendent found that the pp-value for the test is 0.25091 Let: p1=p1= be the proportion of patients at Hospital 1 p2=p2= be the proportion of patients at…A researcher hypothesizes that personality type is related to heart disease. Type A people, who are competitive and impatient are more prone to heart diseases. Type B people, who are more relaxed, are less likely to have heart problems. The following data about personality type and heart disorder are from a random sample. No heart disease heart disease total Type A 32 18 50 Type B 128 22 150 total 160 40 Do these data support that there is a significant relationship between personality type and heart disease? Test at the .05 level of significance. Compute the phi-coefficient to measure the strength of the relationship.
- A correlational study is designed to A) test causal inferences B) assess the assocation between two measures C)compare the means of three or more groups D) manipulate the independent variablesIn a study of the effect of mood on the evaluation of nutritious food, 208 subjects were randomly assigned to read either a happy story ( to induce positive mood) or a control (no story, neutral mood) group. Subjects were then asked to evaluate their attitude toward a certain indulgent food on a nine-point scale, with higher numbers indicating a more positive attitude toward the food. The following table summarizes the data: Group n x bar s Positive mood 104 4.25 2.15 Neutral mood 104 5.25 1.75 Test the hypotheses of no difference between two groups using a two-sample t-test. Compare p-value and α=0.05 Describe the test result.In a study of the effect of mood on the evaluation of nutritious food, 208 subjects were randomly assigned to read either a happy story ( to induce positive mood) or a control (no story, neutral mood) group. Subjects were then asked to evaluate their attitude toward a certain indulgent food on a nine-point scale, with higher numbers indicating a more positive attitude toward the food. The following table summarizes the data: Group n x bar s Positive mood 104 4.25 2.15 Neutral mood 104 5.25 1.75 Test the hypotheses of no difference between two groups using a two-sample t-test. Calculate the degrees of freedom? Calculate test statistic?