In a study of speed dating, male subjects were asked to rate the attractiveness of their female dates, and a sample of the results is listed below (1=not attractive; 10=extremely attractive). Construct a confidence interval using a 99%confidence level. What do the results tell about the mean attractiveness ratings of the population of all adult females? 5,8,3,8,5,5,6,7,9,8,6,9 What is the confidence interval for the population mean μ?
In a study of speed dating, male subjects were asked to rate the attractiveness of their female dates, and a sample of the results is listed below (1=not attractive; 10=extremely attractive). Construct a confidence interval using a 99%confidence level. What do the results tell about the mean attractiveness ratings of the population of all adult females? 5,8,3,8,5,5,6,7,9,8,6,9 What is the confidence interval for the population mean μ?

Glencoe Algebra 1, Student Edition, 9780079039897, 0079039898, 2018
18th Edition
ISBN:9780079039897
Author:Carter
Publisher:Carter
Chapter10: Statistics
Section10.6: Summarizing Categorical Data
Problem 30PPS

Related questions

Question
In a study of speed dating, male subjects were asked to rate the attractiveness of their female dates, and a sample of the results is listed below (1=not attractive; 10=extremely attractive). Construct a confidence interval using a 99%confidence level. What do the results tell about the mean attractiveness ratings of the population of all adult females?
5,8,3,8,5,5,6,7,9,8,6,9
What is the confidence interval for the population mean μ?
Expert Solution
Step 1
Obtain the 99% confidence interval for the population mean μ.
The 99% confidence interval for the population mean μ is obtained below as follows:
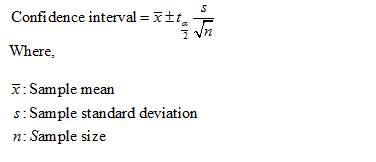
The formula for the Confidence interval for mean is:
Use EXCEL Procedure to obtain values for the given samples.
Follow the instruction to obtain the value of mean and SD:
- Open EXCEL
- Go to Data>Data Analysis.
- Choose Descriptive Statistics.
- Enter the input range as $A$1:$A$13.
- Check the Labels in the first row.
- Check the option Summary statistics
- Click OK.
EXCEL output:
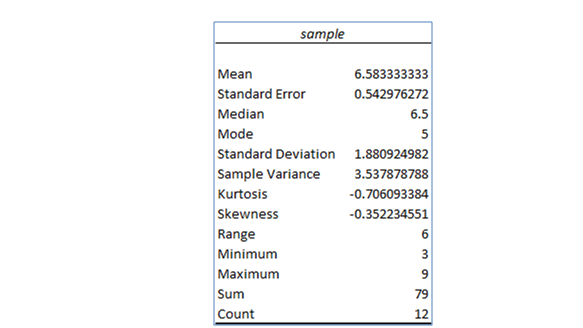
From the EXCEL output, the value of mean is 6.5833 and the standard deviation is 1.8809

Step by step
Solved in 2 steps with 4 images

Knowledge Booster


Learn more about
Need a deep-dive on the concept behind this application? Look no further. Learn more about this topic, statistics and related others by exploring similar questions and additional content below.Recommended textbooks for you
Glencoe Algebra 1, Student Edition, 9780079039897…
Algebra
ISBN:
9780079039897
Author:
Carter
Publisher:
McGraw Hill

College Algebra (MindTap Course List)
Algebra
ISBN:
9781305652231
Author:
R. David Gustafson, Jeff Hughes
Publisher:
Cengage Learning
Glencoe Algebra 1, Student Edition, 9780079039897…
Algebra
ISBN:
9780079039897
Author:
Carter
Publisher:
McGraw Hill
College Algebra (MindTap Course List)
Algebra
ISBN:
9781305652231
Author:
R. David Gustafson, Jeff Hughes
Publisher:
Cengage Learning