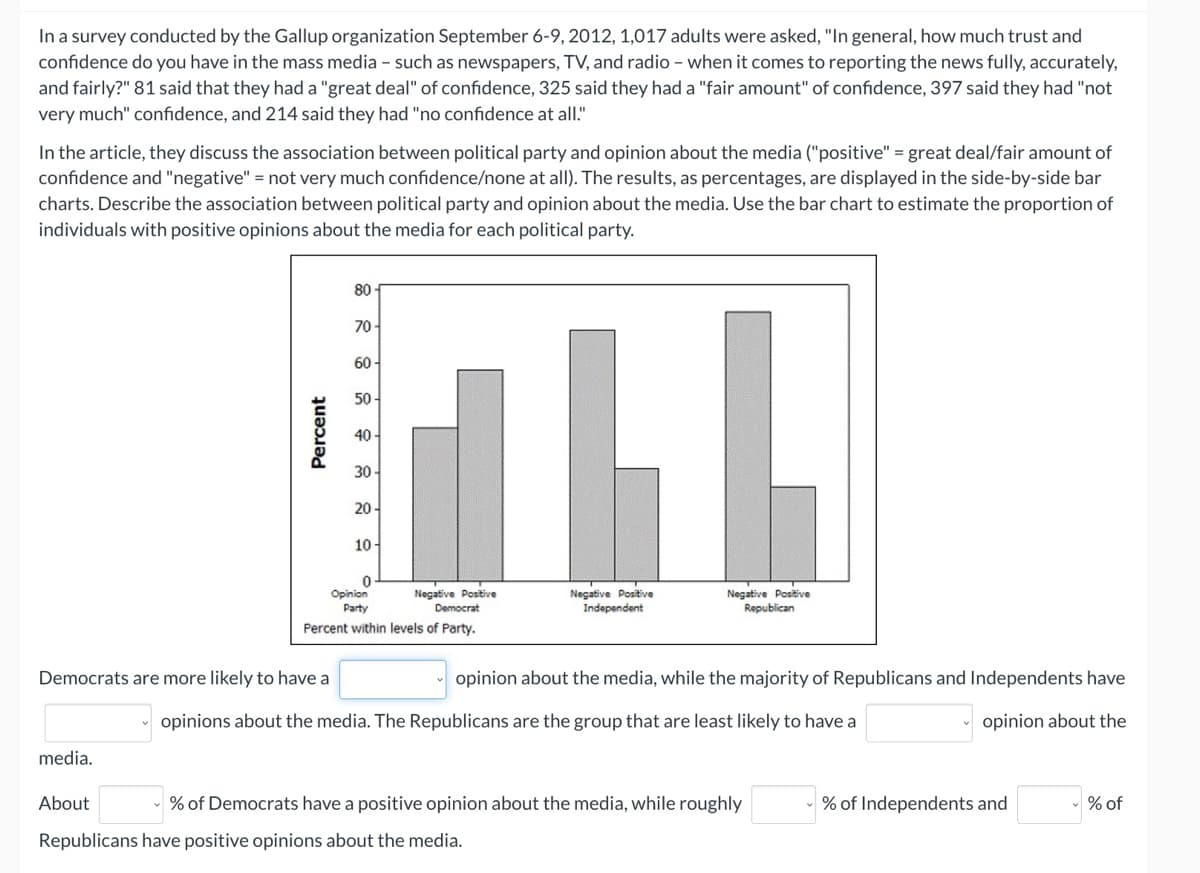
In a survey conducted by the Gallup organization September 6-9, 2012, 1,017 adults were asked, "In general, how much trust and confidence do you have in the mass media - such as newspapers, TV, and radio - when it comes to reporting the news fully, accurately, and fairly?" 81 said that they had a "great deal" of confidence, 325 said they had a "fair amount" of confidence, 397 said they had "not very much" confidence, and 214 said they had "no confidence at all." In the article, they discuss the association between political party and opinion about the media ("positive" = great deal/fair amount of confidence and "negative" = not very much confidence/none at all). The results, as percentages, are displayed in the side-by-side bar charts. Describe the association between political party and opinion about the media. Use the bar chart to estimate the proportion of individuals with positive opinions about the media for each political party. 80- 70- 60 50- 40 - 30 20 - 10- Negative Positive Independent Opinion Negative Postive Republican Negative Postive Party Democrat Percent within levels of Party. Democrats are more likely to have a opinion about the media, while the majority of Republicans and Independents have opinions about the media. The Republicans are the group that are least likely to have a opinion about the media. About % of Democrats have a positive opinion about the media, while roughly % of Independents and % of Republicans have positive opinions about the media. Percent
In a survey conducted by the Gallup organization September 6-9, 2012, 1,017 adults were asked, "In general, how much trust and confidence do you have in the mass media - such as newspapers, TV, and radio - when it comes to reporting the news fully, accurately, and fairly?" 81 said that they had a "great deal" of confidence, 325 said they had a "fair amount" of confidence, 397 said they had "not very much" confidence, and 214 said they had "no confidence at all." In the article, they discuss the association between political party and opinion about the media ("positive" = great deal/fair amount of confidence and "negative" = not very much confidence/none at all). The results, as percentages, are displayed in the side-by-side bar charts. Describe the association between political party and opinion about the media. Use the bar chart to estimate the proportion of individuals with positive opinions about the media for each political party. 80- 70- 60 50- 40 - 30 20 - 10- Negative Positive Independent Opinion Negative Postive Republican Negative Postive Party Democrat Percent within levels of Party. Democrats are more likely to have a opinion about the media, while the majority of Republicans and Independents have opinions about the media. The Republicans are the group that are least likely to have a opinion about the media. About % of Democrats have a positive opinion about the media, while roughly % of Independents and % of Republicans have positive opinions about the media. Percent
Holt Mcdougal Larson Pre-algebra: Student Edition 2012
1st Edition
ISBN:9780547587776
Author:HOLT MCDOUGAL
Publisher:HOLT MCDOUGAL
Chapter11: Data Analysis And Probability
Section11.5: Interpreting Data
Problem 1C
Related questions
Question

Transcribed Image Text:In a survey conducted by the Gallup organization September 6-9, 2012, 1,017 adults were asked, "In general, how much trust and
confidence do you have in the mass media - such as newspapers, TV, and radio - when it comes to reporting the news fully, accurately,
and fairly?" 81 said that they had a "great deal" of confidence, 325 said they had a "fair amount" of confidence, 397 said they had "not
very much" confidence, and 214 said they had "no confidence at all."
In the article, they discuss the association between political party and opinion about the media ("positive" = great deal/fair amount of
confidence and "negative" = not very much confidence/none at all). The results, as percentages, are displayed in the side-by-side bar
charts. Describe the association between political party and opinion about the media. Use the bar chart to estimate the proportion of
individuals with positive opinions about the media for each political party.
80
70-
60 -
50-
40
30
20
10-
Negative Positive
Independent
Negative Postive
Republican
Opinion
Negative Postive
Party
Democrat
Percent within levels of Party.
Democrats are more likely to have a
opinion about the media, while the majority of Republicans and Independents have
opinions about the media. The Republicans are the group that are least likely to have a
opinion about the
media.
About
% of Democrats have a positive opinion about the media, while roughly
% of Independents and
% of
Republicans have positive opinions about the media.
Percent
Expert Solution
This question has been solved!
Explore an expertly crafted, step-by-step solution for a thorough understanding of key concepts.
This is a popular solution!
Trending now
This is a popular solution!
Step by step
Solved in 3 steps

Recommended textbooks for you

Holt Mcdougal Larson Pre-algebra: Student Edition…
Algebra
ISBN:
9780547587776
Author:
HOLT MCDOUGAL
Publisher:
HOLT MCDOUGAL

Glencoe Algebra 1, Student Edition, 9780079039897…
Algebra
ISBN:
9780079039897
Author:
Carter
Publisher:
McGraw Hill

College Algebra (MindTap Course List)
Algebra
ISBN:
9781305652231
Author:
R. David Gustafson, Jeff Hughes
Publisher:
Cengage Learning

Holt Mcdougal Larson Pre-algebra: Student Edition…
Algebra
ISBN:
9780547587776
Author:
HOLT MCDOUGAL
Publisher:
HOLT MCDOUGAL

Glencoe Algebra 1, Student Edition, 9780079039897…
Algebra
ISBN:
9780079039897
Author:
Carter
Publisher:
McGraw Hill

College Algebra (MindTap Course List)
Algebra
ISBN:
9781305652231
Author:
R. David Gustafson, Jeff Hughes
Publisher:
Cengage Learning
