In a survey of 1120 new college graduates 281 had a professional job on graduation day. year ago the proportion of graduates with a professional job on graduation day was .24 or 24%. The setup of the null and alternative hypotheses to test whether there is sufficient evidence to conclude that the proportion of graduates with a professional job is higher now than it was one year ago is: One (a) Ho : p= .24 vs. H1 : p< .24 (b) Họ : p = .24 vs. H1 : p# .24 (c) Ho : p= .24 vs. H1 : p> .24 (d) Ho : p= .25 vs. H1 : p < .25 (e) Ho : p= .25 vs. H1 : p > .24 The value of the test statistic is: (a) 2.109 (b) .011 (c) .841 (d) 28.141 (e) .854
In a survey of 1120 new college graduates 281 had a professional job on graduation day. year ago the proportion of graduates with a professional job on graduation day was .24 or 24%. The setup of the null and alternative hypotheses to test whether there is sufficient evidence to conclude that the proportion of graduates with a professional job is higher now than it was one year ago is: One (a) Ho : p= .24 vs. H1 : p< .24 (b) Họ : p = .24 vs. H1 : p# .24 (c) Ho : p= .24 vs. H1 : p> .24 (d) Ho : p= .25 vs. H1 : p < .25 (e) Ho : p= .25 vs. H1 : p > .24 The value of the test statistic is: (a) 2.109 (b) .011 (c) .841 (d) 28.141 (e) .854

Holt Mcdougal Larson Pre-algebra: Student Edition 2012
1st Edition
ISBN:9780547587776
Author:HOLT MCDOUGAL
Publisher:HOLT MCDOUGAL
Chapter11: Data Analysis And Probability
Section: Chapter Questions
Problem 8CR

Related questions

Topic Video
Question
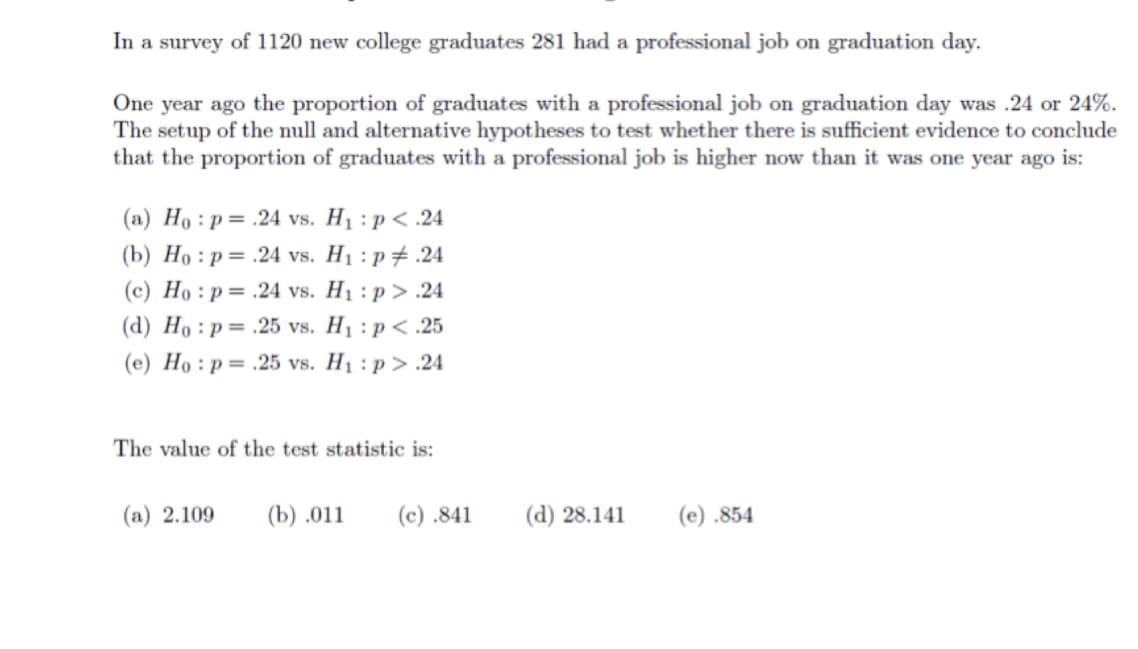
Transcribed Image Text:In a survey of 1120 new college graduates 281 had a professional job on graduation day.
One year ago the proportion of graduates with a professional job on graduation day was .24 or 24%.
The setup of the null and alternative hypotheses to test whether there is sufficient evidence to conclude
that the proportion of graduates with a professional job is higher now than it was one year ago is:
(a) Ho :p= .24 vs. H1 : p< .24
(b) Но : р%3.24 vs. Hi:р#.24
(c) Ho : p= .24 vs. H1 : p > .24
(d) Ho : p = .25 vs. H1 : p< .25
(e) Ho : p= .25 vs. H1 : p > .24
The value of the test statistic is:
(а) 2.109
(b) .011
(c) .841
(d) 28.141
(е) .854
Expert Solution
This question has been solved!
Explore an expertly crafted, step-by-step solution for a thorough understanding of key concepts.

This is a popular solution!

Trending now
This is a popular solution!

Step by step
Solved in 2 steps with 2 images

Knowledge Booster


Learn more about
Need a deep-dive on the concept behind this application? Look no further. Learn more about this topic, statistics and related others by exploring similar questions and additional content below.Recommended textbooks for you
Holt Mcdougal Larson Pre-algebra: Student Edition…
Algebra
ISBN:
9780547587776
Author:
HOLT MCDOUGAL
Publisher:
HOLT MCDOUGAL
Holt Mcdougal Larson Pre-algebra: Student Edition…
Algebra
ISBN:
9780547587776
Author:
HOLT MCDOUGAL
Publisher:
HOLT MCDOUGAL