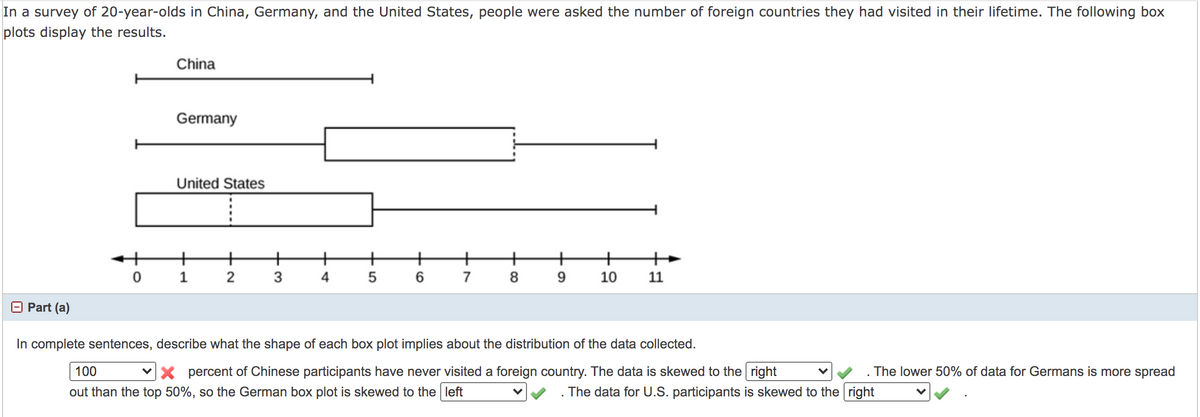
In a survey of 20-year-olds in China, Germany, and the United States, people were asked the number of foreign countries they had visited in their lifetime. The following box plots display the results. China Germany United States + + + + + 9 1 3 4. 6. 7 8. 10 11 O Part (a) In complete sentences, describe what the shape of each box plot implies about the distribution of the data collected. 100 vx percent of Chinese participants have never visited a foreign country. The data is skewed to the right The lower 50% of data for Germans is more spread out than the top 50%, so the German box plot is skewed to the left . The data for U.S. participants is skewed to the right
In a survey of 20-year-olds in China, Germany, and the United States, people were asked the number of foreign countries they had visited in their lifetime. The following box plots display the results. China Germany United States + + + + + 9 1 3 4. 6. 7 8. 10 11 O Part (a) In complete sentences, describe what the shape of each box plot implies about the distribution of the data collected. 100 vx percent of Chinese participants have never visited a foreign country. The data is skewed to the right The lower 50% of data for Germans is more spread out than the top 50%, so the German box plot is skewed to the left . The data for U.S. participants is skewed to the right

Glencoe Algebra 1, Student Edition, 9780079039897, 0079039898, 2018
18th Edition
ISBN:9780079039897
Author:Carter
Publisher:Carter
Chapter10: Statistics
Section10.6: Summarizing Categorical Data
Problem 10CYU

Related questions
Question
Possible answer is 25,50,75 and 100%
Transcribed Image Text:In a survey of 20-year-olds in China, Germany, and the United States, people were asked the number of foreign countries they had visited in their lifetime. The following box
plots display the results.
China
Germany
United States
+
+
1
2
3
6
7
8
9
10
11
O Part (a)
In complete sentences, describe what the shape of each box plot implies about the distribution of the data collected.
100
vX percent of Chinese participants have never visited a foreign country. The data is skewed to the right
The lower 50% of data for Germans is more spread
out than the top 50%, so the German box plot is skewed to the left
The data for U.S. participants is skewed to the right
5
Expert Solution
This question has been solved!
Explore an expertly crafted, step-by-step solution for a thorough understanding of key concepts.

This is a popular solution!

Trending now
This is a popular solution!

Step by step
Solved in 2 steps

Recommended textbooks for you
Glencoe Algebra 1, Student Edition, 9780079039897…
Algebra
ISBN:
9780079039897
Author:
Carter
Publisher:
McGraw Hill

Holt Mcdougal Larson Pre-algebra: Student Edition…
Algebra
ISBN:
9780547587776
Author:
HOLT MCDOUGAL
Publisher:
HOLT MCDOUGAL

Big Ideas Math A Bridge To Success Algebra 1: Stu…
Algebra
ISBN:
9781680331141
Author:
HOUGHTON MIFFLIN HARCOURT
Publisher:
Houghton Mifflin Harcourt
Glencoe Algebra 1, Student Edition, 9780079039897…
Algebra
ISBN:
9780079039897
Author:
Carter
Publisher:
McGraw Hill
Holt Mcdougal Larson Pre-algebra: Student Edition…
Algebra
ISBN:
9780547587776
Author:
HOLT MCDOUGAL
Publisher:
HOLT MCDOUGAL
Big Ideas Math A Bridge To Success Algebra 1: Stu…
Algebra
ISBN:
9781680331141
Author:
HOUGHTON MIFFLIN HARCOURT
Publisher:
Houghton Mifflin Harcourt