In a test of two population means - 41 versus 42 - with unknown variances of and o, two independent samples of ni n2 = 10 were taken. The data is given below. Both populations are normally distributed. = 8 and Sample From Population 1: 13, 23, 16, 12, 20, 23, 15, 10; Sample From Population 2: 16, 16, 18, 13, 18, 16, 17, 20, 15, 16; Download.csv file (a) You wish to test the hypothesis that both populations have the same variance. Choose the correct statistical hypotheses. OA. Họ : of = o HA:o + 0? B. Ho : o # ० H: ० = ० C. Ho : o - o HA:o < o} D. Ho : o = o H: ০>০ E. Ho : S = S3 HA: S7 + S? %3! %3D (b) Determine Levene's test statistic for this test. Use at least two decimals in your answer. Test Statistic - 6.88 (c) Determine the P-value for this test, to at least three decimal places. P- 0.005 (d) Using a = 0.05, the null hypothesis should rejected. variation in Population 1 is statistically different than : the variation in Population 2. From this data and this version of the hypothesis we infer
In a test of two population means - 41 versus 42 - with unknown variances of and o, two independent samples of ni n2 = 10 were taken. The data is given below. Both populations are normally distributed. = 8 and Sample From Population 1: 13, 23, 16, 12, 20, 23, 15, 10; Sample From Population 2: 16, 16, 18, 13, 18, 16, 17, 20, 15, 16; Download.csv file (a) You wish to test the hypothesis that both populations have the same variance. Choose the correct statistical hypotheses. OA. Họ : of = o HA:o + 0? B. Ho : o # ० H: ० = ० C. Ho : o - o HA:o < o} D. Ho : o = o H: ০>০ E. Ho : S = S3 HA: S7 + S? %3! %3D (b) Determine Levene's test statistic for this test. Use at least two decimals in your answer. Test Statistic - 6.88 (c) Determine the P-value for this test, to at least three decimal places. P- 0.005 (d) Using a = 0.05, the null hypothesis should rejected. variation in Population 1 is statistically different than : the variation in Population 2. From this data and this version of the hypothesis we infer

MATLAB: An Introduction with Applications
6th Edition
ISBN:9781119256830
Author:Amos Gilat
Publisher:Amos Gilat
Chapter1: Starting With Matlab
Section: Chapter Questions
Problem 1P

Related questions
Question
B and C are wrong
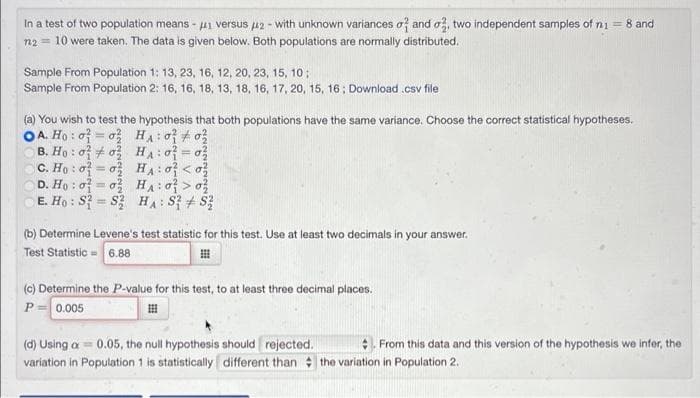
Transcribed Image Text:In a test of two population means - ui versus u2 - with unknown variances of and o, two independent samples of ni = 8 and
n2 = 10 were taken. The data is given below. Both populations are normally distributed.
Sample From Population 1: 13, 23, 16, 12, 20, 23, 15, 10;
Sample From Population 2: 16, 16, 18, 13, 18, 16, 17, 20, 15, 16; Download .csv file
(a) You wish to test the hypothesis that both populations have the same variance. Choose the correct statistical hypotheses.
OA. Họ : o = o} HA:o o
B. Ho : 0 # ०३ H: 0 = 03
C. Ho : o = o HA:o < o?
D. Họ : o7 = o3 HA: o} > o?
E. Ho : S? = S HA: S3 + S3
%3D
(b) Determine Levene's test statistic for this test. Use at least two decimals in your answer.
Test Statistic 6.88
(0) Determine the P-value for this test, to at least three decimal places.
P= 0.005
(d) Using a = 0.05, the null hypothesis should rejected.
From this data and this version of the hypothesis we infer, the
variation in Population 1 is statistically different than the variation in Population 2.
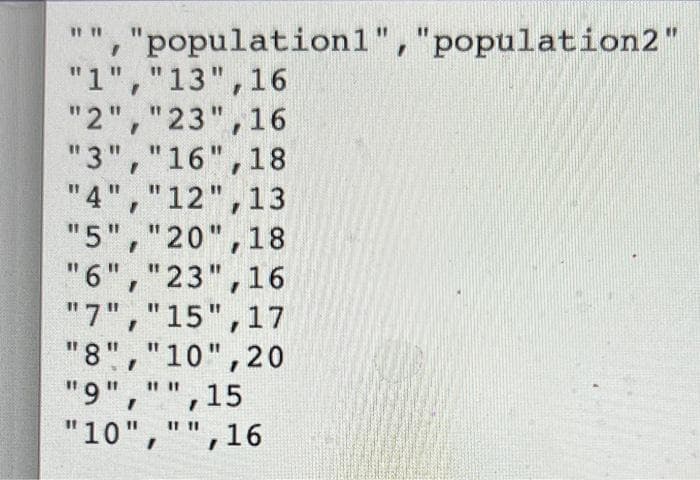
Transcribed Image Text:"population1", "population2"
"1","13",16
"2","23",16
"3","16",18
"4","12",13
"5","20",18
"6","23",16
"7","15",17
"8","10",20
"9","
"10","",16
%3D
%3D
",15
%3D
Expert Solution
This question has been solved!
Explore an expertly crafted, step-by-step solution for a thorough understanding of key concepts.

Step by step
Solved in 6 steps

Recommended textbooks for you
MATLAB: An Introduction with Applications
Statistics
ISBN:
9781119256830
Author:
Amos Gilat
Publisher:
John Wiley & Sons Inc

Probability and Statistics for Engineering and th…
Statistics
ISBN:
9781305251809
Author:
Jay L. Devore
Publisher:
Cengage Learning

Statistics for The Behavioral Sciences (MindTap C…
Statistics
ISBN:
9781305504912
Author:
Frederick J Gravetter, Larry B. Wallnau
Publisher:
Cengage Learning
MATLAB: An Introduction with Applications
Statistics
ISBN:
9781119256830
Author:
Amos Gilat
Publisher:
John Wiley & Sons Inc
Probability and Statistics for Engineering and th…
Statistics
ISBN:
9781305251809
Author:
Jay L. Devore
Publisher:
Cengage Learning
Statistics for The Behavioral Sciences (MindTap C…
Statistics
ISBN:
9781305504912
Author:
Frederick J Gravetter, Larry B. Wallnau
Publisher:
Cengage Learning

Elementary Statistics: Picturing the World (7th E…
Statistics
ISBN:
9780134683416
Author:
Ron Larson, Betsy Farber
Publisher:
PEARSON

The Basic Practice of Statistics
Statistics
ISBN:
9781319042578
Author:
David S. Moore, William I. Notz, Michael A. Fligner
Publisher:
W. H. Freeman

Introduction to the Practice of Statistics
Statistics
ISBN:
9781319013387
Author:
David S. Moore, George P. McCabe, Bruce A. Craig
Publisher:
W. H. Freeman