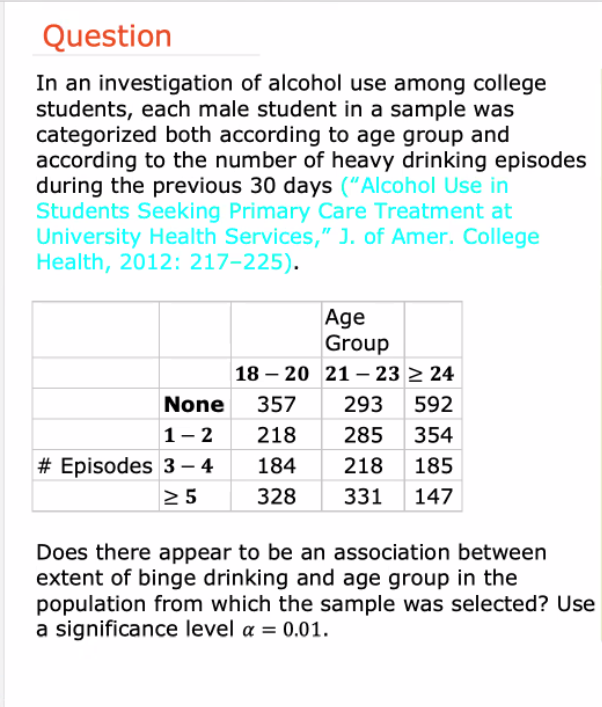
In an investigation of alcohol use among college students, each male student in a sample was categorized both according to age group and according to the number of heavy drinking episodes during the previous 30 days ("Alcohol Use in Students Seeking Primary Care Treatment at
Q: A study, which randomly surveyed 3,700 households and drew on this information from the IRS, found…
A: A study, which randomly surveyed 3,700 households and drew on this information from the IRS, found…
Q: The following data consists of a simple random sample of waiting times (in minutes) for a sample of…
A:
Q: In August and September 2005, Hurricanes Katrina and Rita caused extraordinary flooding in New…
A:
Q: 4. A study was conducted to test diastolic blood pressure readings between patients with sedentary…
A: The data of two groups A and B's diastolic blood pressure readings are given as: Group A Group B…
Q: The tar content in samples of cigar tobacco follows: 1.542 1.585 1.532 1.466 1.499 1.611 1.622 1.466…
A: Given n=sample size =42 α=level of significance=0.10 ∑i=142 xi=64.697 (sum of all…
Q: Consider an experiment with nine groups, with two values in each. For the ANOVA summary table shown…
A: Given that Number of groups c = 9 Total number of observations, n = 9 × 2 = 18
Q: A researcher wants to know whether the acidity of rain (pH) near Houston, Texas, is significantly…
A: In order to determine whether there is significant difference in the pH of rain in Chicago and…
Q: In 44 data from a study to calculate the number of people employed in Mexico, the following results…
A: Let x denotes the number of employed persons. The sample size is n=44. Let μ and σ denote the true…
Q: 1) Using the data from the American Community Survey (IPUMS), the Pew Research Center reported that…
A:
Q: The tar content in samples of cigar tobacco follows: 1.542 1.585 1.532 1.466 1.499…
A:
Q: The tar content in samples of cigar tobacco follows: 1.542 1.585 1.532 1.466 1.499 1.611 1.622 1.466…
A: Let X be the random variable such that tar content in samples of cigar tobacco. It is required to…
Q: The table cross-classifies 68,694 passengers in cars and light trucks involved in accidents in the…
A: Given Table: Wore Seatbelt? Yes Injured or…
Q: s there a relation between incidents of child abuse and number of runaway children? A random sample…
A: To test the claim that there is a monotone-increasing relationship between the ranks of incidents of…
Q: In a study that compared average time taken by a men and women to do a certain job, a random sample…
A: Given Information : In a study that compared average time taken by a men and women to do a certain…
Q: If 8 of 24 remote controls were defective, then the average number of defective remote controls in a…
A: Given that, 8 of 24 remote controls were defective. p=824p=0.33 If n=15 find the average number of…
Q: The tar content in samples of cigar tobacco follows: 1.542 1.585 1.532 1.466 1.499 1.611 1.622 1.466…
A: Step 1: Given, The data are given for the sample of cigar tobacco, For the confidence interval…
Q: In a random consumer survey, randomly selected drivers of Porsche, Mercedes, and BMW were asked to…
A: Given: Porsche Mercedes BMW 10 8 0 8 6 4 6 10 2
Q: In 44 data from a study to calculate the number of people employed in Mexico, the following results…
A: The maximum likelihood estimator of the mean and standard deviation is;…
Q: A study prospectively examined whether sleep-disordered breathing was associated with an increased…
A: Here it is needed to test, whether the study finding give evidence of a significant difference of…
Q: The tar content in samples of cigar tobacco follows: 1.542 1.585 1.532 1.466 1.499 1.611 1.622…
A: From the provided information, Sample size (n) = 42 Sample mean (x̅) and sample standard deviation…
Q: The tar content in samples of cigar tobacco follows: 1.542 1.585 1.532 1.466 1.499 1.611 1.622 1.466…
A: Given: The sample data describe the tar content in cigar tobacco. The number of sampled data values…
Q: The National Safety Council of the U.S. released the following data on the incidence rates for fatal…
A:
Q: In a study entitled "Hello from the Other Side", Yael Schneider studied the frequency, conditions…
A: The population is the whole set of individuals the study is concerned about.
Q: 1. Although there is a popular belief that herbal remedies such as ginkgo biloba and ginseng may…
A:
Q: A random sample of n1 = 16 communities in western Kansas gave the following information for people…
A: To calculate mean you just need to add all the data points in the sample and divide by sample size.…
Q: In a study entitled "Hello from the Other Side", Yael Schneider studied the frequency, conditions…
A: To find: The population in this study?
Q: A researcher wants to know whether the acidity of rain (pH) near Houston, Texas, is significantly…
A:
Q: The tar content in 30 samples of cigar tobacco follows 1.542 1.585 1.532 1.466 1.499 1.611 1.622…
A: Given n=30 X-bar=1.529 S=0.0566
Q: In August and September 2005, Hurricanes Katrina and Rita caused extraordinary flooding in New…
A:
Q: 1. A random sample of companies in electric utilities (I), financial services (II), food processing…
A: From the given information we want to find f critical value.
Q: Researchers examined all sports-related concussions reported to an emergency room from children ages…
A: “Since you have posted a question with multiple sub-parts, we will solve the first three sub-parts…
Q: A random sample of adults in a midwestern state were interviewed twice over a period of two years.…
A: Paired t test : Choose the paired t test (dependent t test, correlation t test) if you two…
Q: Can vaccination be regarded as preventive measure for smallpox, from the data given Below? Of 1,482…
A:
Q: 1. Although there is a popular belief that herbal remedies such as ginkgo biloba and ginseng may…
A:
Q: 1. Although there is a popular belief that herbal remedies such as ginkgo biloba and ginseng may…
A: Hello. Since your question has multiple parts, we will solve first question for you. If you want…
Q: According to the U.S. Department of Justice, Office of Justice Programs, Bureau of Justice…
A: We have to calculate the probabilities in sampling without replacement.
Q: September 1995, we randomly assigned 104 asthma to one of three study groups in the of Inhaled…
A: Given: The box plot and data has given. To find the correct statement which summarize the height…
Q: A Los Angeles research group publishes an an- Lual report on trends in real estate. Suppose 200…
A: Given: Sample size (n) = 200 Sample proportion p^=0.78 Confidence interval = 0.90
Q: In 44 data from a study to calculate the number of people employed in Mexico, the following results…
A: Solution To find the 95% confidence interval we need to find out sample mean and sample standard…
Q: A study prospectively examined whether sleep-disordered breathing was associated with an increased…
A: From the above data The observed Frequencies are None mid moderate severe Death 40 40 20…
Q: In 1972, half of a group of 111 low-income children from Chapel Hill, NC were randomly chosen for…
A: Total number of children =111
Trending now
This is a popular solution!
Step by step
Solved in 2 steps
- Colonoscopy is a medical procedure that is designed to find and remove precancerous lesions in the colon before they become cancerous. The article “Association of Colonoscopy and Death from Colorectal Cancer” (N. Baxter, M. Goldwasser, et al., Annals of Internal Medicine, 2009:1–8) reports that in a sample of 10,292 people diagnosed with colorectal cancer, 7.0% had previously had a colonoscopy, and in a sample of 51,460 people without colorectal cancer, 9.8% had previously had a colonoscopy. Can you conclude that the percentage of people who have had colonoscopies is greater in those without colorectal cancer?Hormone Therapy and Dementia. An issue of Science News (Vol. 163, No. 22, pp. 341–342) reported that the Women’s Health Initiative cast doubts on the benefit of hormone-replacement therapy. Researchers randomly divided 4532 healthy women over the age of 65 years into two groups. One group, consisting of 2229 women, received hormone-replacement therapy; the other group, consisting of 2303 women, received placebo. Over 5 years, 40 of the women receiving the hormone-replacement therapy were diagnosed with dementia, compared with 21 of those getting placebo. a. At the 5% significance level, do the data provide sufficient evidence to conclude that healthy women over 65 years old who take hormone-replacement therapy are at greater risk for dementia than those who do not? b. Determine and interpret a 90% confidence interval for the difference in dementia risk rates for healthy women over 65 years old who take hormone-replacement therapy and those who do not.The paper “Effect of long-term blood pressure control on salt sensitivity” [Journal of Medicine (1997) 28:147–156] describes a study evaluating salt sensitivity (SENS) after a period of antihypertensive treatment. Ten hypertensive patients (diastolic blood pressure between 90 and 115 mmHg) were studied after at least 18 months on antihypertensive treatment. SENS readings, which were obtained before and after the patients were placed on an antihypertensive treatment, are given in the table. 'Before' 'After' 22.86 6.11 7.74 -4.02 15.49 8.04 9.97 3.29 1.44 -0.77 9.39 6.99 11.4 10.19 1.86 2.09 -6.71 11.4 6.42 10.7 a) Write the null and alternate hypotheses What test will be used to test the hypothesis and what assumptions are required? test them. Is there significant evidence that the mean SENS value decreased after the patient received antihypertensive treatment?
- 3.) In a randomized experiment, double-blind clinical trials of Prevnar, infants were randomly divided into twogroups. Subjects in group 1 received Prevnar, while subjects in group 2 received a control vaccine. After the seconddose, 137 of 452 subjects who received Prevnar experienced drowsiness as a side effect. After the second dose, 31of 99 subjects who the control vaccine experienced drowsiness as a side effect. Does the evidence suggest that alower proportion of subjects who took Prevnar experienced drowsiness as a side effect than subjects who had thecontrol vaccine at the ? = 0.01 level of significance?a.) Verify that the requirements for inference about two population proportions is satisfied.b.) What is the Null and Alternative Hypotheses? What test will you be using?c.) What is the level of significance and the ?-value?Baum and Gatchel (1981, Cognitive determinants of reaction to uncontrollable events: Development of reactance andlearned helplessness. Journal of Personality and Social Psychology, 40, 1078-1089) found that students living in longcorridordorms (housing 30 to 40 residents per corridor) had greater feelings of helplessness than those living in shortcorridordorms (housing less than 20 residents per corridor). A resident director at GSU wished to test this finding tolearn whether corridor length impacted students' sense of alienation. She randomly assigned 20 students to live in aresidence hall, with 10 students in long and 10 students in short corridors for the year. At the end of the year, each2/16/21 3student completed a measure of alienation. Below are her data—does corridor length affect feelings of alienation? Use an independent samples t-test to analyze these data. Corridor LengthAlienation Scores From 20 Different StudentsLong =19,15,14,15,15,9,16,15,17,13Short =11,…A Journal published longitudinal study of hearing impairment in a group of elderly patients with intellectual disabilities. The hearing function of each patient was screened each year over a 10 - year period. At the study's conclusion, the hearing loss of each patient was categorized as severe, moderate, mild, or none. The classification of the 28 surviving patients are summarized in the following table. Hearing loss Number of Patients None 7 Mild 7 Moderate 9 Severe 5 Total 28 Conduct a test to determine whether the trueproportions of intellectually disabled elderly patients in each ofthe hearing-loss categories differ. Use a 5% significance level. We are doing this on a Ti84 plus Calculator.
- In a May 2011 study, Federal University Hospital in São Paulo, Brazil, 92 healthy pregnant women were separated into a control group and an experimental group. Those in the experimental group engaged in aerobic water exercise throughout their pregnancy whereas those women in the control group did not. After giving birth the neonatal outcome of the children of all women in the study was recorded where a negative neonatal outcome was defined as a hospital stay of more than four days. A set of similar results is shown in the table Group Positive Neonatal Outcome Negative Neonatal Outcome Water Exercise 22 19 Control Group 21 30 At a 5% level of significance, test the claim that the neonatal outcome was unrelated to the group in which they were assigned. (Water exercise or control group.) Calculate the test statistic as X squared.In a May 2011 study, Federal University Hospital in São Paulo, Brazil, 71 healthy pregnant women were separated into a control group and an experimental group. Those in the experimental group engaged in aerobic water exercise throughout their pregnancy whereas those women in the control group did not. After giving birth the neonatal outcome of the children of all women in the study was recorded where a negative neonatal outcome was defined as a hospital stay of more than four days. A set of similar results is shown in the table Group Positive Neonatal Outcome Negative Neonatal Outcome Water Exercise 15 15 Control Group 12 18 A hypothesis test was carried out, yielding a p-value of 0.396. What is the correct interpretation? 1.Do not reject H0 since the p-value is greater than 0.05. 2. Reject H0 since the p-value is greater than 0.05. 3. Do not reject H0 since the p-value is less than 0.05. 4. Reject H0 since the p-value is less than 0.05. AND Based…In a May 2011 study, Federal University Hospital in São Paulo, Brazil, 71 healthy pregnant women were separated into a control group and an experimental group. Those in the experimental group engaged in aerobic water exercise throughout their pregnancy whereas those women in the control group did not. After giving birth the neonatal outcome of the children of all women in the study was recorded where a negative neonatal outcome was defined as a hospital stay of more than four days. A set of similar results is shown in the table Group Positive Neonatal Outcome Negative Neonatal Outcome Water Exercise 19 17 Control Group 11 19 At a 5% level of significance, test the claim that the neonatal outcome was unrelated to the group in which they were assigned (Water exercise or control group). State the null and alternative hypothesis and identify the claim from the options below 1. H0: Neonatal outcome and group assignment are independent. HA: Neonatal…
- The paper “Effect of Long-Term Blood Pressure Control on Salt Sensitivity” [Journal of Medicine (1997) 28:147–156] describes a study evaluating salt sensitivity (SENS) after a period of antihypertensive treatment. Ten hypertensive patients (diastolic blood pressure between 90 and 115 mmHg)were studied after at least 18 months on antihypertensive treatment. SENS readings, which wereobtained before and after the patients were placed on an antihypertensive treatment, are given here. Is there significant evidence that the mean SENS value decreased after the patient received antihypertensive treatment?The article “The Effects of a Low-Fat, Plant-Based DietaryIntervention on Body Weight, Metabolism, and InsulinSensitivity in Postmenopausal Women” (Amer. J. of Med.,2005: 991–997) reported on the results of an experiment inwhich half of the individuals in a group of 64 postmenopausaloverweight women were randomly assigned to a particularvegan diet, and the other half received a diet based on NationalCholesterol Education Program guidelines. The sample meandecrease in body weight for those on the vegan diet was 5.8kg, and the sample SD was 3.2, whereas for those on the control diet, the sample mean weight loss and standard deviationwere 3.8 and 2.8, respectively. Does it appear the true averageweight loss for the vegan diet exceeds that for the control dietby more than 1 kg? Carry out an appropriate test of hypotheses at significance level .05 based on calculating a P-valueA pathological video game user (PVGU) is a video game user that averages 31 or more hours a week of gameplay. According to the article “Pathological Video Game Use among Youths: A Two-Year Longitudinal Study” (Pediatrics, Vol. 127, No. 2, pp. 319–329) by D. Gentile et al., in 2011, about 9% of children in grades 3–8 were PVGUs. Suppose that, today, five youths in grades 3–8 are randomly selected. Let X represent the number of youths who are PVGUs. n = p = 1 – p = Prepare the probability distribution for the random variable X. Complete the following table. Round your answers to 4 decimal places e.g. 0.XXXX or .XXXX. X = x P(X=x) 0 1 2 3 4 5 ∑=1.0000∑=1.0000 Calculate the probability that EXACTLY three youths are PVGUs. Round your answers to 4 decimal places e.g. 0.XXXX or .XXXX. P(X = 3) = Calculate the probability that AT LEAST two youths are PVGUs. Round your answers to 4 decimal places e.g. 0.XXXX or .XXXX. P(X ≥ 2) = Calculate the…