In anticipation of an upcoming election, officials in Rising Falls County are looking at the distance from each voter's home to that voter's nearest polling station. Assume that the population of all such distances for voters in Rising Falls County is approximately normally distributed. An article for the newspaper Politically Sound claimed that the mean of this population is 5.15 km. You want to test this claim, so you select a random sample of 23 Rising Falls County voters, and for each you record the distance the voter lives from their nearest polling station. Follow the steps below to construct a 90% confidence interval for the population mean of all the distances voters in Rising Falls County live from their nearest polling station. Then state whether the confidence interval you construct contradicts the reporter's claim. (If necessary, consult a list of formulas.) (a) Click on "Take Sample" to see the results for your random sample. Take Sample Number of people Sample size: 23 Sample mean 4.954 Sample standard deviation Enter the values of the sample size, the point estimate of the mean, the sample standard deviation, and the critical value you need for your 90% confidence interval. (Choose the correct critical value from the table of critical values provided.) When you are done, select "Compute". Standard error: 2.361 Ś
In anticipation of an upcoming election, officials in Rising Falls County are looking at the distance from each voter's home to that voter's nearest polling station. Assume that the population of all such distances for voters in Rising Falls County is approximately normally distributed. An article for the newspaper Politically Sound claimed that the mean of this population is 5.15 km. You want to test this claim, so you select a random sample of 23 Rising Falls County voters, and for each you record the distance the voter lives from their nearest polling station. Follow the steps below to construct a 90% confidence interval for the population mean of all the distances voters in Rising Falls County live from their nearest polling station. Then state whether the confidence interval you construct contradicts the reporter's claim. (If necessary, consult a list of formulas.) (a) Click on "Take Sample" to see the results for your random sample. Take Sample Number of people Sample size: 23 Sample mean 4.954 Sample standard deviation Enter the values of the sample size, the point estimate of the mean, the sample standard deviation, and the critical value you need for your 90% confidence interval. (Choose the correct critical value from the table of critical values provided.) When you are done, select "Compute". Standard error: 2.361 Ś

Glencoe Algebra 1, Student Edition, 9780079039897, 0079039898, 2018
18th Edition
ISBN:9780079039897
Author:Carter
Publisher:Carter
Chapter10: Statistics
Section10.4: Distributions Of Data
Problem 19PFA

Related questions
Question
Transcribed Image Text:(b)
(c)
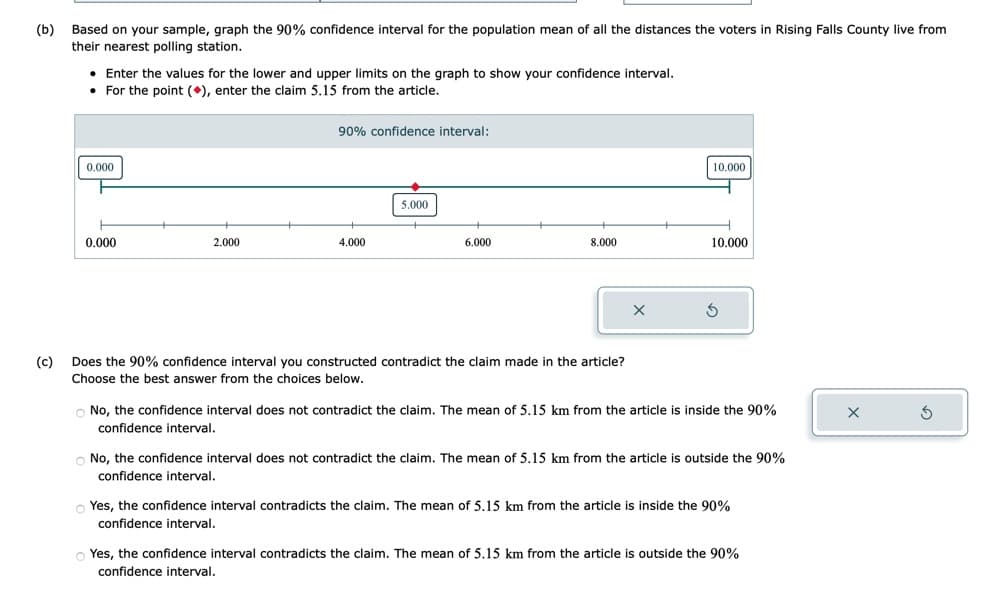
Based on your sample, graph the 90% confidence interval for the population mean of all the distances the voters in Rising Falls County live from
their nearest polling station.
• Enter the values for the lower and upper limits on the graph to show your confidence interval.
For the point (), enter the claim 5.15 from the article.
0.000
0.000
2.000
90% confidence interval:
4.000
5.000
6.000
8.000
Does the 90% confidence interval you constructed contradict the claim made in the article?
Choose the best answer from the choices below.
X
10.000
10.000
S
O No, the confidence interval does not contradict the claim. The mean of 5.15 km from the article is inside the 90%
confidence interval.
No, the confidence interval does not contradict the claim. The mean of 5.15 km from the article is outside the 90%
confidence interval.
Yes, the confidence interval contradicts the claim. The mean of 5.15 km from the article is inside the 90%
confidence interval.
Yes, the confidence interval contradicts the claim. The mean of 5.15 km from the article is outside the 90%
confidence interval.
X
S
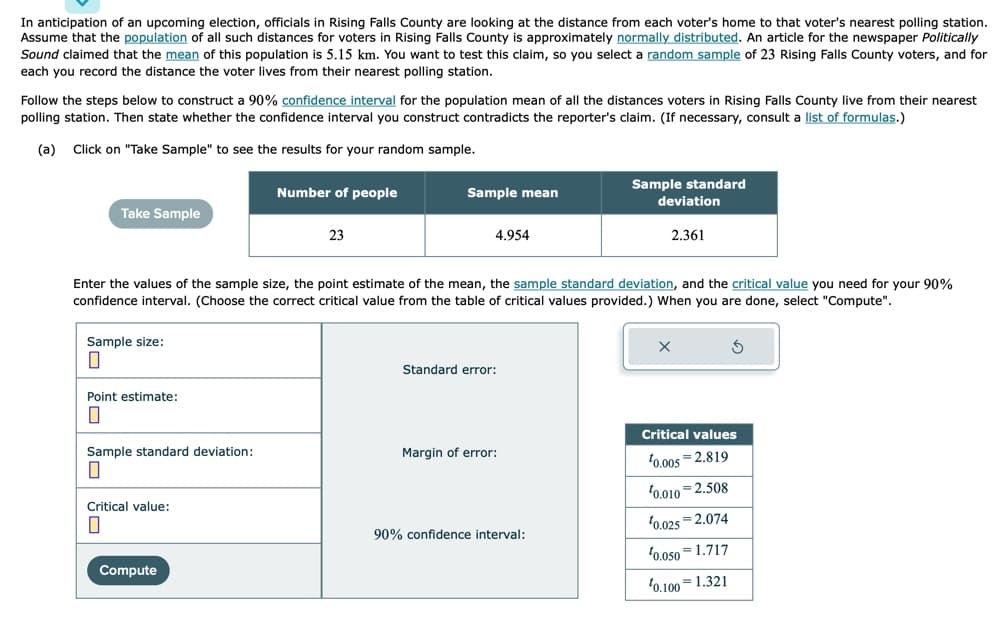
Transcribed Image Text:In anticipation of an upcoming election, officials in Rising Falls County are looking at the distance from each voter's home to that voter's nearest polling station.
Assume that the population of all such distances for voters in Rising Falls County is approximately normally distributed. An article for the newspaper Politically
Sound claimed that the mean of this population is 5.15 km. You want to test this claim, so you select a random sample of 23 Rising Falls County voters, and for
each you record the distance the voter lives from their nearest polling station.
Follow the steps below to construct a 90% confidence interval for the population mean of all the distances voters in Rising Falls County live from their nearest
polling station. Then state whether the confidence interval you construct contradicts the reporter's claim. (If necessary, consult a list of formulas.)
(a) Click on "Take Sample" to see the results for your random sample.
Take Sample
Sample size:
П
Point estimate:
0
Sample standard deviation:
0
Critical value:
0
Number of people
Compute
23
Sample mean
Enter the values of the sample size, the point estimate of the mean, the sample standard deviation, and the critical value you need for your 90%
confidence interval. (Choose the correct critical value from the table of critical values provided.) When you are done, select "Compute".
4.954
Standard error:
Margin of error:
Sample standard
90% confidence interval:
deviation
2.361
X
Critical values
0.005 2.819
0.010 2.508
¹0.025=2.074
10.050 1.717
¹0.100 1.321
Expert Solution
This question has been solved!
Explore an expertly crafted, step-by-step solution for a thorough understanding of key concepts.

This is a popular solution!

Trending now
This is a popular solution!

Step by step
Solved in 2 steps

Recommended textbooks for you
Glencoe Algebra 1, Student Edition, 9780079039897…
Algebra
ISBN:
9780079039897
Author:
Carter
Publisher:
McGraw Hill
Glencoe Algebra 1, Student Edition, 9780079039897…
Algebra
ISBN:
9780079039897
Author:
Carter
Publisher:
McGraw Hill