In Excel Answer each of the following problem (II) using regression analysis (easiest way is using the scatter diagram approach. But you can also use the regression analysis routine in the Data Analysis module in Excel 
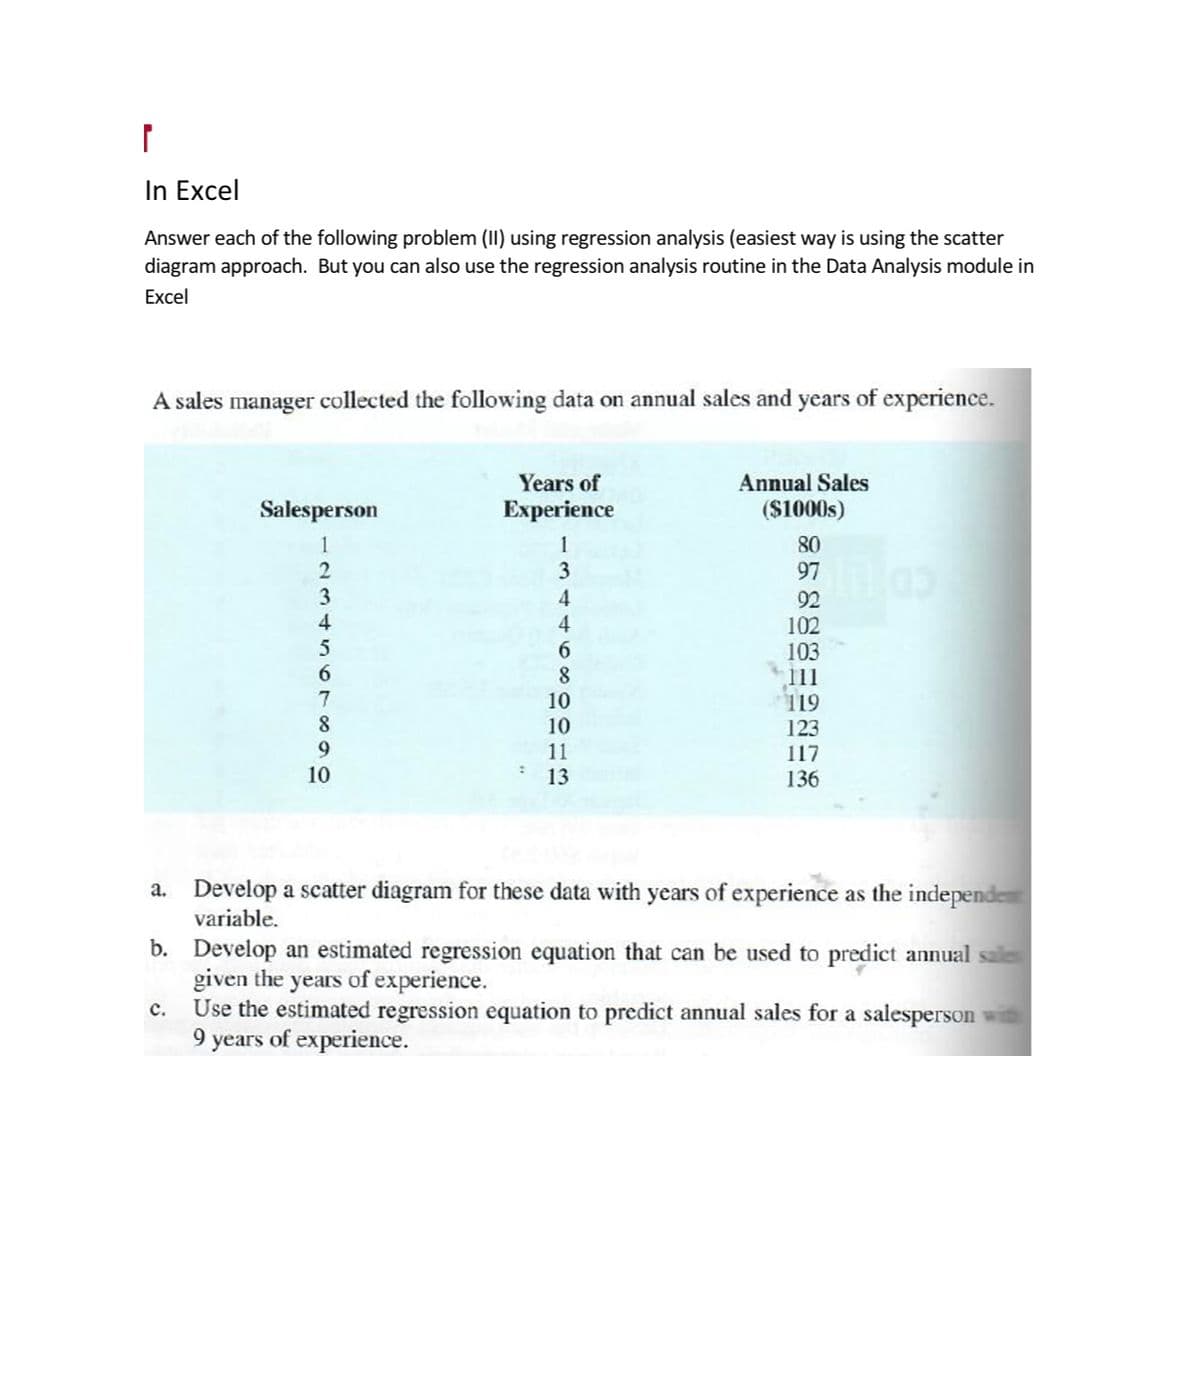
A sales manager collected the following data on annual sales and years of experience. a. b. C. Salesperson 1 2 3 4 5 6 7 8 9 10 Years of Experience 1 3 4 4 6 8 10 10 11 13 Annual Sales ($1000s) 80 97 92 102 103 119 123 117 136 Develop a scatter diagram for these data with years of experience as the independe variable. Develop an estimated regression equation that can be used to predict annual sales given the years of experience. Use the estimated regression equation to predict annual sales for a salesperson 9 years of experience.
Q: Explain the input/output transformation process in the following organizations A Hair Saloon
A: The input/output transformation process is a process of change that is initiated by the management.…
Q: Consider the following transportation decision-making information: Plant Capacity Store Demand…
A: Given data:
Q: Develop a lot-for-lot solution (enter your responses as whole numbers). Period Gross requirements…
A: Find the Calculation methods below: Project on hand = Project on hand - Gross requirementsNet…
Q: Instructions There are four parts to this problem. Use Excel to perform the following. a. Use the…
A: using the same formula for EOQ as instructed. a.
Q: Which of the following statements are correct regarding PERT and the critical path method (CPM)?…
A: The critical path is the longest chain of activities that must be completed in order to wrap up a…
Q: Resource Management includes processes to identify, acquire, and manage resources needed to…
A: Planning, organizing, managing, and evaluating the efforts of human workers are all part of resource…
Q: How many arcs will the network have?
A: The transportation model is used to calculate the minimum cost of the route by selecting different…
Q: The total cost, excluding normal time labor costs, for Plan A = $. (Enter your response as a whole…
A: Find the Calculation methods below: Output forecast = (Production - Demand) + Subcontract…
Q: Binary variables are variables whose only possible values are 0 or 1. True or False True False
A: A variable shows an attribute that can be precisely estimated & that can evaluate the distinct…
Q: Which projects should be selected? What is the total net present value of these projects
A: Linear programming is a mathematical technique that is also used in operations management…
Q: What is the earliest start (ES) and earliest finish (EF) times?
A: A network diagram related to the project shows the sequence of the task that is performed to…
Q: A retailer has two stores selling the same product. Weekly demand at store 1 is normally distributed…
A: Inventory pooling is done to comprehend the risk involved in the supply chain. The risk are…
Q: A chart used to accent the size of change is called:
A: Column chart:- The data is shown in the rectangular bars with the height proportionate to the…
Q: a) How many tires should Rocky Mountain order each time it places an order? Rocky Mountain's optimal…
A: EOQ = √(2DS/H) Annual Holding cost = (Q*H)/2 Annual Setup cost = (D*S)/Q Annual purchase cost =…
Q: Given the projected demands for the next six months, prepare an aggregate plan that uses inventory,…
A: Find the Calculation methods below: Output Forecast = (Regular Output - Forecast) + Overtime +…
Q: A sound company compresses and palletizes boxes of merchandise for recycling. In the warehouses They…
A: Given data: Storage cost per day H = $0.10 No. of pallets generated daily = 5 pallets a day Fixed…
Q: What are the objectives of total quality management in operation management ?
A: Introduction : Total Quality Quality Management is an approach of operation management. Total…
Q: Suppose that a fire station receives an average of 24 requests for fire pumps every hour. Each…
A: Arrival rate λ = 24 requests per hr Service rate μ = 120×60 = 3 requests per hr ρ=λs×μρ=24s×3 Here,…
Q: The disadvantages of "operations" in supply chain management
A: Every business needs procedures to enable daily success and long-term viability. A supply chain…
Q: Terex Corporation is a global manufacturer of aerial work platforms and materials processing…
A: Inventory: In every business inventory management is very essential and business…
Q: Answer each of the following two problems (1) using regression analysis (easiest way is using the…
A: Given data is
Q: a)Determine the service level b) determine optimal stocking level
A: Uniform distribution refers to the scenario in which the probability of all the outcomes is equally…
Q: a) What is the optimal size of the production run? b) What is the average holding cost per year? $…
A: Production is the process in which inputs are combined to have the required output. It includes a…
Q: The four factors of production (input) needed for the manufacturing process of the book stores new…
A: Inputs required for the factors of production of book shop's new stationery line: Inputs used to…
Q: (a) Draw a network with t, ES, EF, LS, and LF (follow the same format as Figure 11.5 on p.394).
A: As per Bartleby guidelines, we can only solve the first three subparts of one question at a…
Q: January February March April 1,400 1,500 1,600 1,800 Her operations manager is considering a new…
A: Given data is Stockout cost = $100 per unit Inventory holding cost = $25 per unit Subcontract cost…
Q: What is the assembly-line efficiency? Round your answer to one decimal place. %
A: Project schedule helps in calculating different values all related to the production cycle like the…
Q: AAA auto supply store sells snow tires which are ordered every Friday to meet next week's demand.…
A: Given data: Sales price = $50 per tireCost of tire =$35 Carrying cost = $2 per tire Order…
Q: From the following list, select the two vital functions performed by project management software
A: a) Calculating a project's duration and schedule:- Project management software has various tools…
Q: A manufacturer produces both widgets and gadgets. Widgets generate a profit of $70 each and gadgets…
A: Linear programming is a mathematical technique that is also used in operations management…
Q: business model for capitalizing value from not just products but also service offerings
A: USAA business model works in providing the below offerings: Claims Insurance Banking Investment…
Q: K Rocky Mountain Tire Center sells 13,000 go-cart tires per year. The ordering cost for each order…
A: Optimal order quantity is the quantity that company should order and purchase to fulfill the…
Q: (a) Reformulate this problem as a general linear programming problem, and then solve it manually by…
A: The transportation model is used to calculate the minimum cost of the route by selecting different…
Q: H.James Harrinton, a noted quality consultant, related the following story in Quality digest…
A: According to Garvin, Dimensions of quality has 8 aspects. These are: Performance: Essential…
Q: Solve manually, not excel An IT analyst found four projects “tickets” in their inbox at 8:00 AM.…
A: As per the question, First, determine the Due dates of each ticket: Given: Initially, tickets were…
Q: Radovilsky Manufacturing Company, in Hayward, California, makes flashing lights for toys. The…
A: Ordering cost is the cost that incurred during the purchase and maintenance of the raw materials in…
Q: QUESTION 3 Mr. John produces a special type of shoes on an assembly line. The process involves eight…
A: While demonstrating how to balance the assembly line following information is needed. Desired…
Q: Given the following list of items, Item Annual Demand 101 102 103 104 105 201 202 203 204 205 Item…
A: Formulae used: For Part a) Compute the annual usage cost of each item = Annual Demand × Unit Price…
Q: a-1. How many containers should be used? (Round up your answer to the next whole number.) Answer is…
A: Production is the process in which inputs are combined to have the required output. It includes a…
Q: What is the average number of boats that will be waiting for service? (c) What is the average time…
A: Queuing theory is the study of waiting for lines/queues. This model helps to determine the length…
Q: how are you calculating the SL value of 1.64?
A: Given data is Average daily demand (d) = 70 units Lead time (L) = 4 days The standard deviation of…
Q: Stanford Rosenberg Computing wants to establish an assembly line for producing a new product, the…
A: Find the Calculation methods below: Cycle Time = Available TimeDemand
Q: One unit of A is made of two units of B and one unit of C. B is made of three units of D and one…
A: Find the Calculation methods below: Project on hand = Project on hand - Gross requirementsNet…
Q: DM Office Products (DMOP) is a wholesale supplier of office products with one facility in…
A: Centroid method helps the businessman to find out the best location for manufacturing and…
Q: For the pressure of aerosol cans, the process mean is 78.24 and the process standard deviation is…
A: The process capability index (Cpk) refers to the arithmetical calculation to determine the closeness…
Q: rm wishes to choose at least 2 of 4 possible activities (A, B, C and D), the constraint XÃ + XB + XC…
A: Ans) There are 4 projects: Project A : Xa Project B : Xb Project C : Xc Project D : Xd…
Q: With activities B and C as immediate predecessors, the earliest start time for activity H must be…
A: Given: Duration of activity H (D) = 12 Early start time of activity H (ES) = 9
Q: 2.13 Consider a simple three-step manufacturing process as illustrated in the given figure. Assuming…
A: Given data: Defect rate for Process-1 (d1) = 3% Defect rate for Process-2 (d2) = 5%Defect rate for…
Q: StockCo is considering five investments. The net present value (NPV) and capital require- ments over…
A: Given data is Investment NPV Capital req year 1 Capital req year 2 1 4000 2500 1000 2 6000…
Q: Packaging may be defined as the general group of activities in product planning which involves…
A: Packaging is a crucial part of any business's supply chain. If it's too pricey, you might miss out…
Step by step
Solved in 2 steps with 3 images
- The owner of a restaurant in Bloomington, Indiana, has recorded sales data for the past 19 years. He has also recorded data on potentially relevant variables. The data are listed in the file P13_17.xlsx. a. Estimate a simple regression equation involving annual sales (the dependent variable) and the size of the population residing within 10 miles of the restaurant (the explanatory variable). Interpret R-square for this regression. b. Add another explanatory variableannual advertising expendituresto the regression equation in part a. Estimate and interpret this expanded equation. How does the R-square value for this multiple regression equation compare to that of the simple regression equation estimated in part a? Explain any difference between the two R-square values. How can you use the adjusted R-squares for a comparison of the two equations? c. Add one more explanatory variable to the multiple regression equation estimated in part b. In particular, estimate and interpret the coefficients of a multiple regression equation that includes the previous years advertising expenditure. How does the inclusion of this third explanatory variable affect the R-square, compared to the corresponding values for the equation of part b? Explain any changes in this value. What does the adjusted R-square for the new equation tell you?The Baker Company wants to develop a budget to predict how overhead costs vary with activity levels. Management is trying to decide whether direct labor hours (DLH) or units produced is the better measure of activity for the firm. Monthly data for the preceding 24 months appear in the file P13_40.xlsx. Use regression analysis to determine which measure, DLH or Units (or both), should be used for the budget. How would the regression equation be used to obtain the budget for the firms overhead costs?Suppose that a regional express delivery service company wants to estimate the cost of shipping a package (Y) as a function of cargo type, where cargo type includes the following possibilities: fragile, semifragile, and durable. Costs for 15 randomly chosen packages of approximately the same weight and same distance shipped, but of different cargo types, are provided in the file P13_16.xlsx. a. Estimate a regression equation using the given sample data, and interpret the estimated regression coefficients. b. According to the estimated regression equation, which cargo type is the most costly to ship? Which cargo type is the least costly to ship? c. How well does the estimated equation fit the given sample data? How might the fit be improved? d. Given the estimated regression equation, predict the cost of shipping a package with semifragile cargo.
- Stock market analysts are continually looking for reliable predictors of stock prices. Consider the problem of modeling the price per share of electric utility stocks (Y). Two variables thought to influence this stock price are return on average equity (X1) and annual dividend rate (X2). The stock price, returns on equity, and dividend rates on a randomly selected day for 16 electric utility stocks are provided in the file P13_15.xlsx. Estimate a multiple regression equation using the given data. Interpret each of the estimated regression coefficients. Also, interpret the standard error of estimate and the R-square value for these data.The management of a technology company is trying to determine the variable that best explains the variation of employee salaries using a sample of 52 full-time employees; see the file P13_08.xlsx. Estimate simple linear regression equations to identify which of the following has the strongest linear relationship with annual salary: the employees gender, age, number of years of relevant work experience prior to employment at the company, number of years of employment at the company, or number of years of post secondary education. Provide support for your conclusion.Do the sales prices of houses in a given community vary systematically with their sizes (as measured in square feet)? Answer this question by estimating a simple regression equation where the sales price of the house is the dependent variable, and the size of the house is the explanatory variable. Use the sample data given in P13_06.xlsx. Interpret your estimated equation, the associated R-square value, and the associated standard error of estimate.
- Management of a home appliance store would like to understand the growth pattern of the monthly sales of Blu-ray disc players over the past two years. Managers have recorded the relevant data in the file P13_33.xlsx. a. Create a scatterplot for these data. Comment on the observed behavior of monthly sales at this store over time. b. Estimate an appropriate regression equation to explain the variation of monthly sales over the given time period. Interpret the estimated regression coefficients. c. Analyze the estimated equations residuals. Do they suggest that the regression equation is adequate? If not, return to part b and revise your equation. Continue to revise the equation until the results are satisfactory.The file P13_26.xlsx contains the monthly number of airline tickets sold by the CareFree Travel Agency. a. Create a time series chart of the data. Based on what you see, which of the exponential smoothing models do you think will provide the best forecasting model? Why? b. Use simple exponential smoothing to forecast these data, using a smoothing constant of 0.1. c. Repeat part b, but search for the smoothing constant that makes RMSE as small as possible. Does it make much of an improvement over the model in part b?The file P13_28.xlsx contains monthly retail sales of U.S. liquor stores. a. Is seasonality present in these data? If so, characterize the seasonality pattern. b. Use Winters method to forecast this series with smoothing constants = = 0.1 and = 0.3. Does the forecast series seem to track the seasonal pattern well? What are your forecasts for the next 12 months?
- A trucking company wants to predict the yearly maintenance expense (Y) for a truck using the number of miles driven during the year (X1) and the age of the truck (X2, in years) at the beginning of the year. The company has gathered the data given in the file P13_13.xlsx. Note that each observation corresponds to a particular truck. Estimate a multiple regression equation using the given data. Interpret each of the estimated regression coefficients. Also, interpret the standard error of estimate and the R-square value for these data.The file P13_42.xlsx contains monthly data on consumer revolving credit (in millions of dollars) through credit unions. a. Use these data to forecast consumer revolving credit through credit unions for the next 12 months. Do it in two ways. First, fit an exponential trend to the series. Second, use Holts method with optimized smoothing constants. b. Which of these two methods appears to provide the best forecasts? Answer by comparing their MAPE values.An antique collector believes that the price received for a particular item increases with its age and with the number of bidders. The file P13_14.xlsx contains data on these three variables for 32 recently auctioned comparable items. Estimate a multiple regression equation using the given data. Interpret each of the estimated regression coefficients. Is the antique collector correct in believing that the price received for the item increases with its age and with the number of bidders? Interpret the standard error of estimate and the R-square value for these data.