Instructions There are four parts to this problem. Use Excel to perform the following. a. Use the economic order quantity formula (EOQ = SQRT((2SD/H)) to determine the optimal number of units that the company should order based on each assumed level of order based on each assumed level of order quantities provided in the data. b. Complete the table by calculating the number of orders per year, annual order cost, annual holding cost, and annual total cost. Highlight the minimum annual total cost using conditional formatting. Hint: The minimum cost should equal the cost at the EOQ you calculated in part a. c. Create a line chart that graphs annual order cost, annual holding cost, and annual total cost. The x-axis should be the quantity ordered. Include a chart legend, appropriate chart title, axes labels, and properly formatted amounts on the axes.  d. Examine the chart and your responses to parts a and b. Indicate any relationships.
Practical Management Science
6th Edition
ISBN:9781337406659
Author:WINSTON, Wayne L.
Publisher:WINSTON, Wayne L.
Chapter2: Introduction To Spreadsheet Modeling
Section: Chapter Questions
Problem 20P: Julie James is opening a lemonade stand. She believes the fixed cost per week of running the stand...
icon
Related questions
Question
100%

Instructions

There are four parts to this problem. Use Excel to perform the following.

a. Use the economic order quantity formula (EOQ = SQRT((2SD/H)) to determine the optimal number of units that the company should order based on each assumed level of order based on each assumed level of order quantities provided in the data.

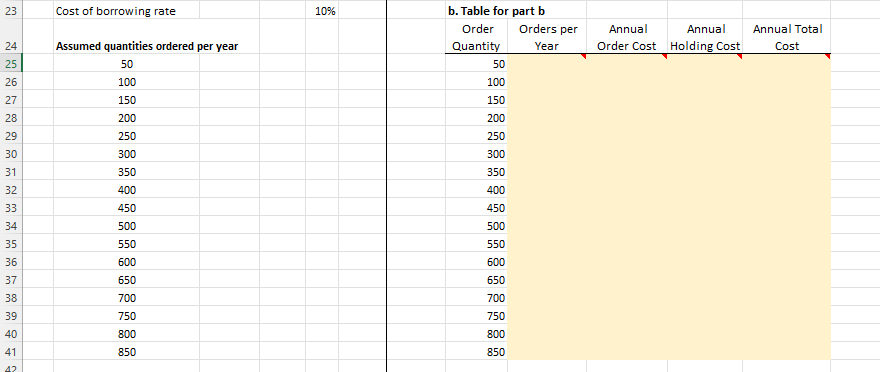
b. Complete the table by calculating the number of orders per year, annual order cost, annual holding cost, and annual total cost. Highlight the minimum annual total cost using conditional formatting. Hint: The minimum cost should equal the cost at the EOQ you calculated in part a.

c. Create a line chart that graphs annual order cost, annual holding cost, and annual total cost. The x-axis should be the quantity ordered. Include a chart legend, appropriate chart title, axes labels, and properly formatted amounts on the axes. 

d. Examine the chart and your responses to parts a and b. Indicate any relationships. 
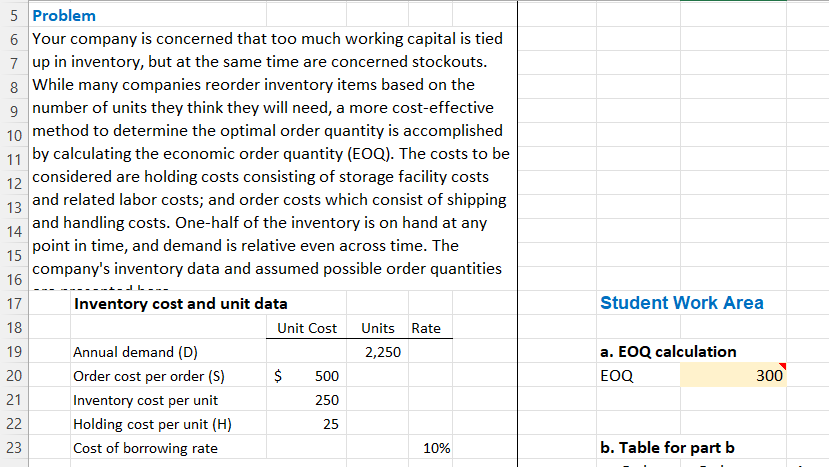
5 Problem
6 Your company is concerned that too much working capital is tied
7 up in inventory, but at the same time are concerned stockouts.
8 While many companies reorder inventory items based on the
9 number of units they think they will need, a more cost-effective
10 method to determine the optimal order quantity is accomplished
11 by calculating the economic order quantity (EOQ). The costs to be
12
considered are holding costs consisting of storage facility costs
and related labor costs; and order costs which consist of shipping
14 and handling costs. One-half of the inventory is on hand at any
point in time, and demand is relative even across time. The
company's inventory data and assumed possible order quantities
13
15
16
| L
17
Inventory cost and unit data
18
19
20
21
22
23
Annual demand (D)
Order cost per order (S)
Inventory cost per unit
Holding cost per unit (H)
Cost of borrowing rate
Unit Cost Units Rate
2,250
$
500
250
25
10%
Student Work Area
a. EOQ calculation
EOQ
b. Table for part b
300
Transcribed Image Text:5 Problem 6 Your company is concerned that too much working capital is tied 7 up in inventory, but at the same time are concerned stockouts. 8 While many companies reorder inventory items based on the 9 number of units they think they will need, a more cost-effective 10 method to determine the optimal order quantity is accomplished 11 by calculating the economic order quantity (EOQ). The costs to be 12 considered are holding costs consisting of storage facility costs and related labor costs; and order costs which consist of shipping 14 and handling costs. One-half of the inventory is on hand at any point in time, and demand is relative even across time. The company's inventory data and assumed possible order quantities 13 15 16 | L 17 Inventory cost and unit data 18 19 20 21 22 23 Annual demand (D) Order cost per order (S) Inventory cost per unit Holding cost per unit (H) Cost of borrowing rate Unit Cost Units Rate 2,250 $ 500 250 25 10% Student Work Area a. EOQ calculation EOQ b. Table for part b 300
23
24
25
26
27
28
29
30
31
32
33
34
35
36
37
38
39
40
41
42
Cost of borrowing rate
Assumed quantities ordered per year
50
100
150
200
250
300
350
400
450
500
550
600
650
700
750
800
850
10%
b. Table for part b
Order
Quantity
50
100
150
200
250
300
350
400
450
500
550
600
650
700
750
800
850
Orders per
Year
Annual
Annual
Order Cost Holding Cost
Annual Total
Cost
Transcribed Image Text:23 24 25 26 27 28 29 30 31 32 33 34 35 36 37 38 39 40 41 42 Cost of borrowing rate Assumed quantities ordered per year 50 100 150 200 250 300 350 400 450 500 550 600 650 700 750 800 850 10% b. Table for part b Order Quantity 50 100 150 200 250 300 350 400 450 500 550 600 650 700 750 800 850 Orders per Year Annual Annual Order Cost Holding Cost Annual Total Cost
Expert Solution
trending now

Trending now

This is a popular solution!

steps

Step by step

Solved in 2 steps with 5 images

Blurred answer
Similar questions
  • SEE MORE QUESTIONS
Recommended textbooks for you
Practical Management Science
Operations Management
ISBN:
9781337406659
Author:
WINSTON, Wayne L.
Publisher:
Cengage,
Operations Management
ISBN:
9781259667473
Author:
William J Stevenson
Publisher:
McGraw-Hill Education
Operations and Supply Chain Management (Mcgraw-hi…
Operations Management
ISBN:
9781259666100
Author:
F. Robert Jacobs, Richard B Chase
Publisher:
McGraw-Hill Education
Business in Action
Business in Action
Operations Management
ISBN:
9780135198100
Author:
BOVEE
Publisher:
PEARSON CO
Purchasing and Supply Chain Management
Operations Management
ISBN:
9781285869681
Author:
Robert M. Monczka, Robert B. Handfield, Larry C. Giunipero, James L. Patterson
Publisher:
Cengage Learning
Production and Operations Analysis, Seventh Editi…
Operations Management
ISBN:
9781478623069
Author:
Steven Nahmias, Tava Lennon Olsen
Publisher:
Waveland Press, Inc.