In lecture, we analyzed the simulated results of rolling five normal dice a total of 1,000 times. We determined that the mean of the distribution of sample means was about 3.5, which is the mean of the population of rolls (1, 2, 3, 4, 5, 6). We also determined that the mean of the sample proportions for odd rolls was about 0.5. This agreed with the population result, where 3/6 numbers in the population are odd. How would you expect these results to change if each of the five dice were weighted according to the table below? In particular, how would this affect the mean of the distribution of sample means? The mean of the distribution of sample proportions for odd rolls? Discuss from a qualitative perspective. You do not need to perform any calculations here. Roll Probability 1 0.1 2 0.1 3 0.1 4 0.4 0.1 0.2
In lecture, we analyzed the simulated results of rolling five normal dice a total of 1,000 times. We determined that the mean of the distribution of sample means was about 3.5, which is the mean of the population of rolls (1, 2, 3, 4, 5, 6). We also determined that the mean of the sample proportions for odd rolls was about 0.5. This agreed with the population result, where 3/6 numbers in the population are odd. How would you expect these results to change if each of the five dice were weighted according to the table below? In particular, how would this affect the mean of the distribution of sample means? The mean of the distribution of sample proportions for odd rolls? Discuss from a qualitative perspective. You do not need to perform any calculations here. Roll Probability 1 0.1 2 0.1 3 0.1 4 0.4 0.1 0.2

Glencoe Algebra 1, Student Edition, 9780079039897, 0079039898, 2018
18th Edition
ISBN:9780079039897
Author:Carter
Publisher:Carter
Chapter10: Statistics
Section10.4: Distributions Of Data
Problem 19PFA

Related questions
Topic Video
Question
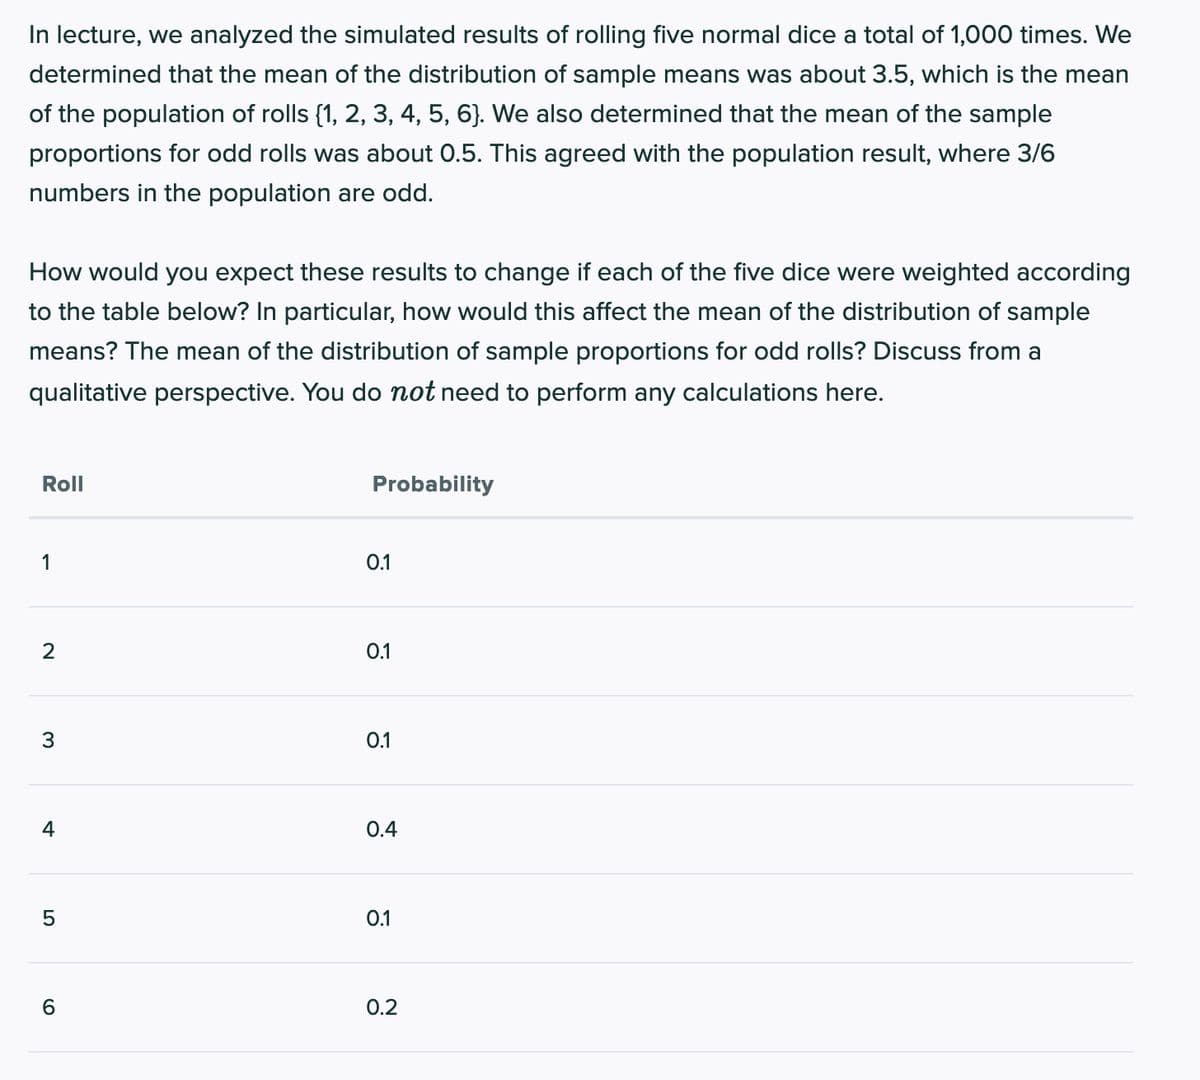
Transcribed Image Text:In lecture, we analyzed the simulated results of rolling five normal dice a total of 1,000 times. We
determined that the mean of the distribution of sample means was about 3.5, which is the mean
of the population of rolls {1, 2, 3, 4, 5, 6}. We also determined that the mean of the sample
proportions for odd rolls was about 0.5. This agreed with the population result, where 3/6
numbers in the population are odd.
How would you expect these results to change if each of the five dice were weighted according
to the table below? In particular, how would this affect the mean of the distribution of sample
means? The mean of the distribution of sample proportions for odd rolls? Discuss from a
qualitative perspective. You do not need to perform any calculations here.
Roll
Probability
1
0.1
2
0.1
3
0.1
4
0.4
0.1
6.
0.2
Expert Solution
This question has been solved!
Explore an expertly crafted, step-by-step solution for a thorough understanding of key concepts.

Step by step
Solved in 2 steps with 1 images

Knowledge Booster


Learn more about
Need a deep-dive on the concept behind this application? Look no further. Learn more about this topic, statistics and related others by exploring similar questions and additional content below.Recommended textbooks for you
Glencoe Algebra 1, Student Edition, 9780079039897…
Algebra
ISBN:
9780079039897
Author:
Carter
Publisher:
McGraw Hill

College Algebra (MindTap Course List)
Algebra
ISBN:
9781305652231
Author:
R. David Gustafson, Jeff Hughes
Publisher:
Cengage Learning
Glencoe Algebra 1, Student Edition, 9780079039897…
Algebra
ISBN:
9780079039897
Author:
Carter
Publisher:
McGraw Hill
College Algebra (MindTap Course List)
Algebra
ISBN:
9781305652231
Author:
R. David Gustafson, Jeff Hughes
Publisher:
Cengage Learning