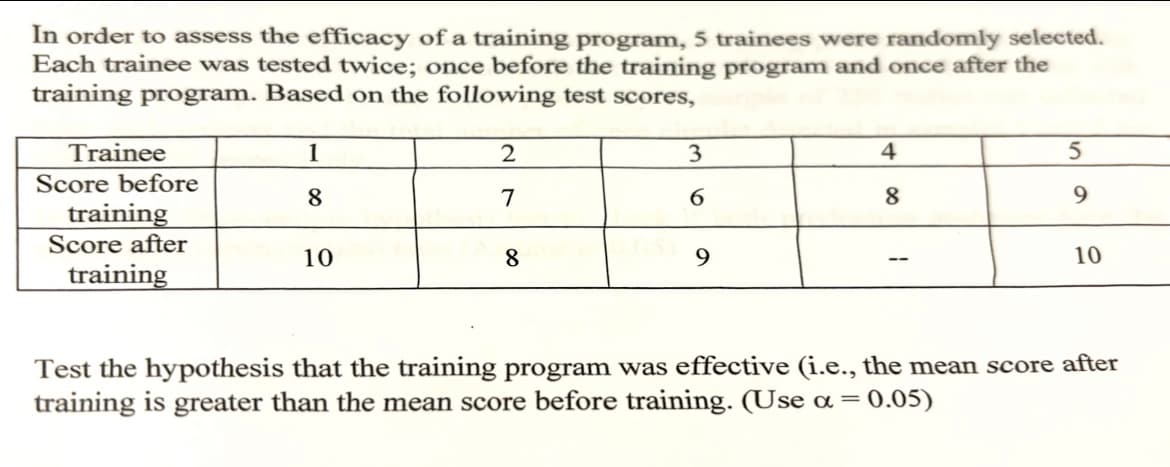
In order to assess the efficacy of a training program, 5 trainees were randomly selected. Each trainee was tested twice; once before the training program and once after the training program. Based on the following test scores, Trainee Score before 1 2 3 4 5 8 7 6 8 9 training Score after training 10 8 9 -- 10 Test the hypothesis that the training program was effective (i.e., the mean score after training is greater than the mean score before training. (Use α = 0.05)


Q: Let X be a random variable of a continuous type and let it be given by Mx(t) = 1 t<1 (1-t)² Find the…
A: Let a continuous random variable, X ~ Gamma (α, β). The probability density function of X is, f(x) =…
Q: cw2 Here is a Frequency Distribution Table (FDT) for a small data set: data freq 33 1 34 2…
A: Mean:To find the mean, we'll use the formula: Mean = Σ(data * freq) / Σ(freq)Calculations:Σ(data *…
Q: A study is being conducted to compare vitamin C and zinc to determine which is better at fighting…
A: Step 1:Let μc equal the mean of the effectivenessof the vitamin c and μz equal the mean of the…
Q: None
A: To find the 99% prediction interval for the height of the daughter, we need to follow these steps:…
Q: Project A Project B Project C Year 1: 15 000 Year 1: 13 000 Year 1: 10 000 Year 2:…
A: Profitability Index AnalysisHere's a step-by way of-step evaluation the usage of the profitability…
Q: The grades on a language midterm are roughly symmetric with p 69 and σ = 4.0. Vanessa scored a 65 on…
A: To find Vanessa"s z-score, we need to use the z-score formula shown below. Formula:z=σx−μ Where:x =…
Q: Answer the questions below. (a) In a survey, a soft drink company asks people to…
A: a) measure gives the most frequently mentioned is the mode b)The data given is: 40, 42, 43, 44, 45,…
Q: Not answer chatgtp
A: The following factors need to be taken into consideration in order to arrive at an accurate…
Q: Pls explain also all options in detail..
A: The more is the randomness in the data, the more is the scattering, the less will be the value of…
Q: Pavan
A: To compare the weekly salaries of female and male employees at a company, I calculated the mean…
Q: Hello, I am extremely confused on the following questions. Can I get help with all of them? They…
A:
Q: Can you help me solve this using R?
A: Interpretation:Intercept (95% CI): When Consumer Debt is zero, we estimate that Household Debt is…
Q: please answer in text form and in proper format answer with must explanation , calculation for each…
A: Detailed explanation:1. Understand the Median: A continuous distribution's median m is, by…
Q: please answer in text form and in proper format answer with must explanation , calculation for each…
A: Step 1:Sample of the current year.n1=400, and p1=400220=0.55Sample of the previous year.n2=400,…
Q: A multiple-choice test has 100 questions, each with four alternatives. At least 60 correct answers…
A: Step 1: Binomial distribution,P(X=r)=nCrprqn−rTotal number of independent trials,n=100number of…
Q: please answer in text form and in proper format answer with must explanation , calculation for each…
A: Conclusion:At the 10% significance level, we compare the calculated test statistic with the critical…
Q: what is the explanation and solution why A is the correct answer in the given question?
A: Step 1:The 90% confidence interval of the slope of the regression line is given as:Interval =…
Q: Please not answer chatgtp
A: e) Calculate the t-statistic using the formula:t=n1s12+n2s22Xˉ1−Xˉ2Given data:x̄1 = 20…
Q: Calcium levels in people are normally distributed with a mean of 9.5 mg dL mg and a standard…
A: The given mean and standard deviation, respectively, are:μ=9.5,σ=0.4 Required is the calcium level,…
Q: None
A: To determine the sample size required to estimate the mean score on a standardized test within 4…
Q: A tile is selected from seven tiles, each labeled with a different letter from the first seven…
A: The objective of the question is to determine the outcomes of different events based on the…
Q: 3. Consider two independent normal distributions N(#1, 400) and N(μ2, 225). Let = μ₁ μ2. Let and…
A: a) The power function in terms of the standard normal CDF has been derived. b) The sample size n…
Q: We are given the random variable X that follow an exponential distribution such as: X ~ Exp…
A: Step 1:1.The random variable x follows exponential distribution with parameter λ = 1/9.848.The…
Q: Hello, May I get help on this VERY SOON please? I’m confused and a clear explanation would be…
A: Step 1: Givenμ=−5σ=3 Step 2: Calculate the z-score corresponding to the score of…
Q: Where applicable, indicate who are the components of the matrix formulation of the RLM model…
A: To begin, the given matrices represent the results of a regression analysis. The matrix \( X'X \)…
Q: For three categorical variables X, Y and Z: a. When Y is jointly independent of X and Z, show that X…
A: To address your questions, let's consider the definitions and properties of joint, marginal, and…
Q: A number cube with faces labeled 1 to 6 is rolled once.The number rolled will be recorded as…
A: The objective of the question is to determine the outcomes of different events when a number cube…
Q: Hello, May I get help on this VERY SOON please? I’m confused and a clear explanation would be…
A: Step 1: Complete the outcomes table and write the probability of each event. Step 2:P(A)+(B)−P(A and…
Q: The following data set indicates the number of leather bags sold per week by a local company, over a…
A: 1. **Mean**: The mean is simply the average of all the values in the data set. You add up all the…
Q: Chapter 6 4. Female heights are normally distributed with a mean of 64 inches and a standard…
A: Step 1:We have given that :mean(μ)=64 inchesstandarddeviation(σ)=2 inches.(a).Find the percentage of…
Q: Recorded here are the germination times (in days) for 16 randomly chosen seeds of a new type of…
A: We will construct a t-interval since the population standard deviation is not known. Find the sample…
Q: vid 5 A group of people were asked if they had run a red light in the last year. 158 responded…
A: The total number of people surveyed is obtained by adding the number of people that answered "yes"…
Q: A box contains 8 tickets, labeled with the numbers -4, -2, -1, 1, 4, 6, 8, 9. In 10independent draws…
A:
Q: (6 pts) Let X ~ N(60, 100) be a normal random variable with fl = 60 and o? = 100.Find q such…
A:
Q: Gubser Welding, Inc., operates a welding service for construction and automotive repair jobs. Assume…
A: a-b. Computation of Mean Arrival Rate and Mean Service Rate: JobsHoursStandard DeviationMean= Jobs /…
Q: The owners of Hamburger Hop are concerned that many of their customers are starting to purchase…
A: Approach to solving the question: In the two independent samples application with a continuous…
Q: Pavan
A: Certainly! Let's break down the explanation into simpler steps: 1. **Understanding the Problem**:…
Q: A simple random sample with n = 57 provided a sample mean of 29.5 and a sample standard deviation…
A:
Q: Three distributions, labeled (a), (b), and (c) are represented below by their histograms. Each…
A: In the context of statistical distributions, the standard deviation serves as a measure of the…
Q: In each of 15 consecutive years, 1000 high school completers were randomly selected and the number…
A: To find the values for the centerline, upper control limit (UCL), and lower control limit (LCL) for…
Q: A series of surveys in GARISSA, carried out from 1990 to 1998, asked random samples of men and women…
A: The objective of the question is to analyze the data provided in the table and describe the trends…
Q: cw 1.2 The Acme Company manufactures widgets. The distribution of widget weights is bell-shaped. The…
A:
Q: For the first six months of the year, an analyst records the monthly closing stock price (in $) for…
A: 1) Mean is given as, Mean=655+58+...+62=56.83 Std deviation is given as, s=n−1∑(Xi−Xˉ)2=4.07 2)…
Q: The mean of the frequency distribution is ☐ degrees. (Round to the nearest tenth as needed.) Which…
A: However, the question does not provide specific values for the computed mean or the actual mean, so…
Q: jxo Mail-in x O Logins x Dashbo: X Assignm X BPMNP X | M IMPORT. X mani/Downloads/Assignment%203.pdf…
A: Step 1:Step 2:Step 3:Step 4:Step 5:Step 6:Step 7:
Q: PLEASE SOLVE ON EXCEL. USE ROUNDOFF. THIS IS DIFFERENT DROM OTHER SOLUTIONS: major airline uses an…
A: Histogram VisualizationHistogram: This is a graphical representation of the distribution of…
Q: None
A: The correct option is:G. Yes, because the graph satisfies all of the criteria for a normal curve.A…
Q: 5.3.10. In 1927, the year he hit sixty home runs, Babe Ruth batted .356, having collected 192 hits…
A:
Q: Pavan
A: To calculate the test statistic for a contingency table, we use the chi-square test. The formula for…
Q: The red blood cell counts (in 105 cells per microliter) of a healthy adult measured on 6…
A: The red blood cell counts are: 53, 51, 52, 48, 54, 48.1. **Calculate the mean (average):** Mean =…

Step by step
Solved in 2 steps with 4 images

- What is meant by the sample space of an experiment?Independent random samples of 27 people living on the west side of a city and 26 people living on the east side of a city were taken to determine if the income levels of west side residents are less than the income levels of east side residents. Given the testing statistics below, determine if the data provides sufficient evidence to conclude that the income levels of west side residents are less than the income levels of east side residents, at the 4% significance levelIs College Worth It? In the New York Times article “College Graduates Fare Well in Jobs Market, Even through Recession,” C. Rampell noted that college graduates have suffered through the recession and lackluster recovery with remarkable resilience. Of a random sample of 1020 college graduates, 35 were unemployed; and of a random sample of 1008 high-school graduates (no college), 69 were unemployed. a. At the 1% significance level, do the data provide sufficient evidence to conclude that college graduates have a lower unemployment rate than high-school graduates? b. Find and interpret a 98% confidence interval for the difference in unemployment rates of college and high-school graduates.
- 3. Hypothesis Testing: Comparing Two Population ParametersIn 1980, of 750 men 20-34 years old, 130 were found to be overweight. Whereas, in 1990, of 700 men, 20-34 years old, 160 were found to be overweight. At the 5% significance level, do the data provide sufficient evidence to conclude that, for men 20-34 years old, a higher percentage were overweight in 1990 than 10 years earlier? Conduct the test using the p-value approach.An article claimed that "those with a college degree reported a higher incidence of sunburn than those without a high school degree—45 percent versus 26 percent." For purposes of this exercise, suppose that these percentages were based on random samples of size 200 from each of the two groups of interest (college graduates and those without a high school degree). Is there convincing evidence that the proportion who experience a sunburn is higher for college graduates than it is for those without a high school degree? (Use pcollege graduates − pwithout a high school degree. Round your test statistic to two decimal places and your P-value to four decimal places.) z = P =People who were born between 1978 and 1983 are sometimes classified by demographers as "Generation Y". According to a Forrester Research survey published in American Demographics (Vol. 22(1), p. 12), of 850 Generation Y Web users, 459 reported using the Internet to download music. At the 5% significance level, does the data provide sufficient evidence to conclude that a majority of Generation Y Web users use the Internet to download music? Use the One-Proportion z-test and interpret your result.
- A certain HMO is attempting to show the benefits of managed care to an insurance company. The HMO believes that certain types of doctors are more cost-effective than others. One theory is that certification level is an important factor in measuring the cost-effectiveness of physicians. To investigate this, the HMO obtained independent random samples of 27 physicians from each of the three certification levels—Board certified (C); Uncertified, board eligible (E); and Uncertified, board ineligible (I)—and recorded the total per-member, per-month charges for each (a total of 27 physicians). In order to compare the mean charges for the three groups, the data will be subjected to an analysis of variance. Write the null hypothesis tested by the ANOVA.A management dean claims that out of 14,700 students who took the midterm examination, 10,016 received a leakage of the test. To validate this claim, a random sample of 800 has been selected, and 506 of them had received an examination leakage. At 1% significance level, is there sufficient evidence to reject the dean’s claim? a. Use the critical-value approach.b. Use the ?-value method.For a statistics class project, a college student randomly samples 75 men who exercise at a gym regularly and 68 women who exercise at a gym regularly. The college student records the number of minutes each person exercises in a given week. The college student believes that the mean number of minutes per week is lower for men than for women. The college student conducts a hypothesis test at the 5% significance level. What conclusion can you draw from the output? The data provide sufficient evidence to reject the null hypothesis and to conclude that the mean number of minutes exercised per week is lower for men than for women. The data provide sufficient evidence to conclude that there is no difference in the mean number of minutes exercised per week for men and women. The data do not provide sufficient evidence to conclude that the mean number of minutes exercised per week is lower for men than for women. We accept the null hypothesis, and conclude that there is a difference in…
- An economist is studying salaries for high technology companies and wants to test the claim that the average salary for high tech employees is less than $70,000. The economist selects a sample of 35 random employees from various high tech companies and records their salaries. Based on past studies, the economist determines that the population standard deviation is $8,500. The economist conducts a one-mean hypothesis test at the 5% significance level to test the claim that the average salary for high tech employees is less than $70,000. Which is the correct setup for the null and alternative hypothesis for this example? Select the correct answer below: H0:μ=70,000; Ha:μ<70,000, which is a left-tailed test. H0:μ=70,000; Ha:μ>70,000, which is a right-tailed test H0:μ<70,000; Ha:μ=70,000, which is a left-tailed test. H0:μ>70,000; Ha:μ=70,000, which is a left-tailed test.An agency that hires out clerical workers claims its workers can type, on average, at least 60 words per minute (wpmwpm). To test the claim, a random sample of 50 workers from the agency were given a typing test, and the average typing speed was 58.8 wpmwpm. A one-sample tt-test was conducted to investigate whether there is evidence that the mean typing speed of workers from the agency is less than 60 wpmwpm. The resulting pp-value was 0.267. Which of the following is a correct interpretation of the pp-value? The probability is 0.267 that the mean typing speed is 60 wpmwpm or more for workers from the agency. A The probability is 0.267 that the mean typing speed is 60 wpmwpm or less for workers from the agency. B The probability is 0.267 that the mean typing speed is 58.8 wpmwpm or less for workers from the agency. C If the mean typing speed of workers from the agency is 60 wpmwpm, the probability of selecting a sample of 50 workers with mean 58.8…