In order to conduct the study, 12 chain stores were randomly selected and divided into three groups of four stores. Strategy 1 was used in four stores, strategy 2 in four others, and strategy 3 in the remaining four stores. The allocation of strategy to stores was made randomly. The amount of sales (in RM 000’s) during a month at each of the twelve stores were recorded. It is known that the monthly sales in all stores are approximately normally distributed. Obtain 95% confidence interval of difference between the mean sales for the month in stores with display type II and display type III.Based on the value calculated, determine if the difference in the mean sales is statistically significant.
In order to conduct the study, 12 chain stores were randomly selected and divided into three groups of four stores. Strategy 1 was used in four stores, strategy 2 in four others, and strategy 3 in the remaining four stores. The allocation of strategy to stores was made randomly. The amount of sales (in RM 000’s) during a month at each of the twelve stores were recorded. It is known that the monthly sales in all stores are approximately normally distributed. Obtain 95% confidence interval of difference between the mean sales for the month in stores with display type II and display type III.Based on the value calculated, determine if the difference in the mean sales is statistically significant.

Linear Algebra: A Modern Introduction
4th Edition
ISBN:9781285463247
Author:David Poole
Publisher:David Poole
Chapter3: Matrices
Section3.7: Applications
Problem 44EQ

Related questions

Topic Video
Question
In order to conduct the study, 12 chain stores were randomly selected and
divided into three groups of four stores. Strategy 1 was used in four stores,
strategy 2 in four others, and strategy 3 in the remaining four stores. The
allocation of strategy to stores was made randomly. The amount of sales (in
RM 000’s) during a month at each of the twelve stores were recorded. It is
known that the monthly sales in all stores are approximately
distributed
Obtain 95% confidence interval of difference between the mean sales
for the month in stores with display type II and display type III.Based on the value calculated, determine if the difference in the mean sales is statistically significant.
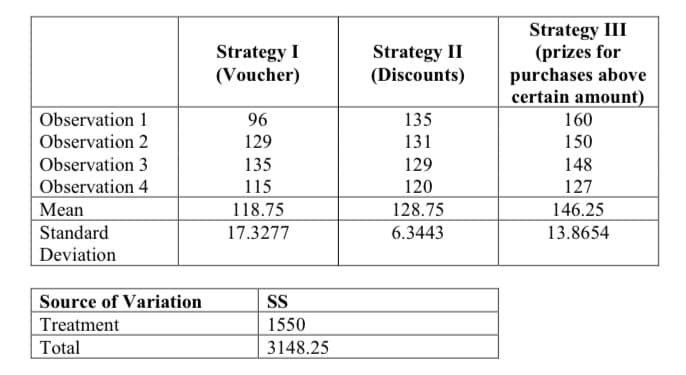
Transcribed Image Text:Strategy III
(prizes for
purchases above
certain amount)
Strategy I
(Voucher)
Strategy II
(Discounts)
Observation 1
96
135
160
Observation 2
129
131
150
Observation 3
135
129
148
Observation 4
115
120
127
Mean
118.75
128.75
146.25
Standard
Deviation
17.3277
6.3443
13.8654
Source of Variation
Treatment
Total
SS
1550
3148.25
Expert Solution
This question has been solved!
Explore an expertly crafted, step-by-step solution for a thorough understanding of key concepts.

Step by step
Solved in 3 steps with 1 images

Knowledge Booster


Learn more about
Need a deep-dive on the concept behind this application? Look no further. Learn more about this topic, statistics and related others by exploring similar questions and additional content below.Recommended textbooks for you
Linear Algebra: A Modern Introduction
Algebra
ISBN:
9781285463247
Author:
David Poole
Publisher:
Cengage Learning

Functions and Change: A Modeling Approach to Coll…
Algebra
ISBN:
9781337111348
Author:
Bruce Crauder, Benny Evans, Alan Noell
Publisher:
Cengage Learning
Linear Algebra: A Modern Introduction
Algebra
ISBN:
9781285463247
Author:
David Poole
Publisher:
Cengage Learning
Functions and Change: A Modeling Approach to Coll…
Algebra
ISBN:
9781337111348
Author:
Bruce Crauder, Benny Evans, Alan Noell
Publisher:
Cengage Learning