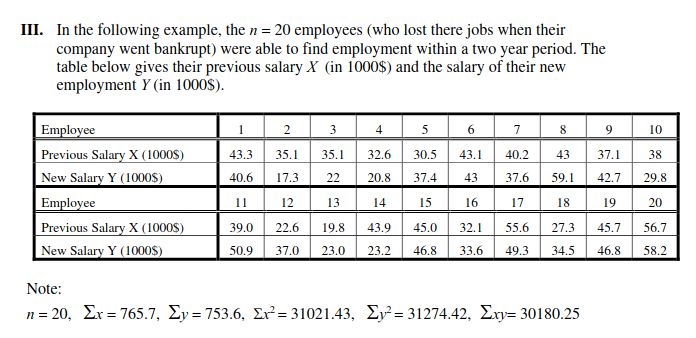
III. In the following example, the n = 20 employees (who lost there jobs when their company went bankrupt) were able to find employment within a two year period. The table below gives their previous salary X (in 1000$) and the salary of their new employment Y (in 1000$). 4 5 Employee Previous Salary X (1000S) New Salary Y (1000S) 2 3 6. 7 8 10 43.3 35.1 35.1 32.6 30.5 43.1 40.2 43 37.1 38 40.6 17.3 22 20.8 37.4 43 37.6 59.1 42.7 29.8 Employee 11 12 13 14 15 16 17 18 19 20 Previous Salary X (1000S) New Salary Y (1000S) 39.0 22.6 19.8 43.9 45.0 32.1 55.6 27.3 45.7 56.7 50.9 37.0 23.0 23.2 46.8 33.6 49.3 34.5 46.8 58.2 Note: n= 20, Σx7657, Σy -753.6, Σ3102143 , Σν31274.42, Σxy-30180.25


Correlation
Correlation defines a relationship between two independent variables. It tells the degree to which variables move in relation to each other. When two sets of data are related to each other, there is a correlation between them.
Linear Correlation
A correlation is used to determine the relationships between numerical and categorical variables. In other words, it is an indicator of how things are connected to one another. The correlation analysis is the study of how variables are related.
Regression Analysis
Regression analysis is a statistical method in which it estimates the relationship between a dependent variable and one or more independent variable. In simple terms dependent variable is called as outcome variable and independent variable is called as predictors. Regression analysis is one of the methods to find the trends in data. The independent variable used in Regression analysis is named Predictor variable. It offers data of an associated dependent variable regarding a particular outcome.
a) Determine the standard deviation of the residuals, s.
b) Determine the predicted value of Y when X = 47.6.
c) Determine the residual for the 12th employee.


Trending now
This is a popular solution!

Step by step
Solved in 2 steps with 2 images


