In order to improve the living standards of the people in Philippines after the devastating typhoon Haiyan, the government decided to increase the labour wage per hour from AUD 17.50 to AUD 25.00. Also, Philippines experienced structural unemployment and frictional unemployment. What is the hardest type of unemployment that Philippines experienced as a result of typhoon Haiyan? Explain your answer. Use the figure below to examine the effects of the government minimum wage of AUD 25.00 in Philippines. Examine the effect of government minimum wage of AUD 25.00. Assume the increase labour is equivalent to the total labour force and calculate the unemployment rate
In order to improve the living standards of the people in Philippines after the devastating typhoon Haiyan, the government decided to increase the labour wage per hour from AUD 17.50 to AUD 25.00. Also, Philippines experienced structural unemployment and frictional unemployment. What is the hardest type of unemployment that Philippines experienced as a result of typhoon Haiyan? Explain your answer. Use the figure below to examine the effects of the government minimum wage of AUD 25.00 in Philippines. Examine the effect of government minimum wage of AUD 25.00. Assume the increase labour is equivalent to the total labour force and calculate the unemployment rate

Chapter17: Inflation
Section: Chapter Questions
Problem 9SQ

Related questions
Question
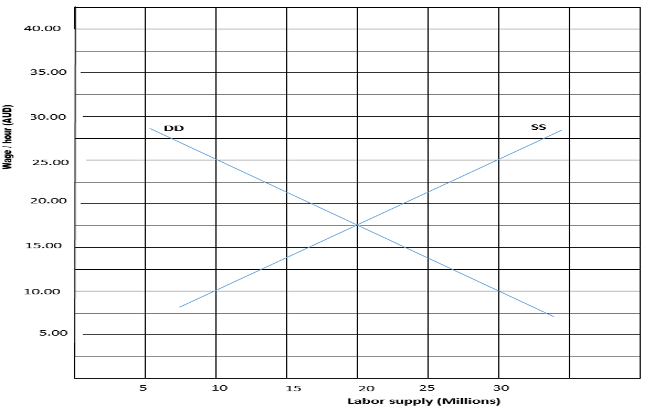
In order to improve the living standards of the people in Philippines after the devastating typhoon Haiyan, the government decided to increase the labour wage per hour from AUD 17.50 to AUD 25.00. Also, Philippines experienced structural
- What is the hardest type of unemployment that Philippines experienced as a result of typhoon Haiyan? Explain your answer.
- Use the figure below to examine the effects of the government minimum wage of AUD 25.00 in Philippines.
- Examine the effect of government minimum wage of AUD 25.00. Assume the increase labour is equivalent to the total labour force and calculate the unemployment rate
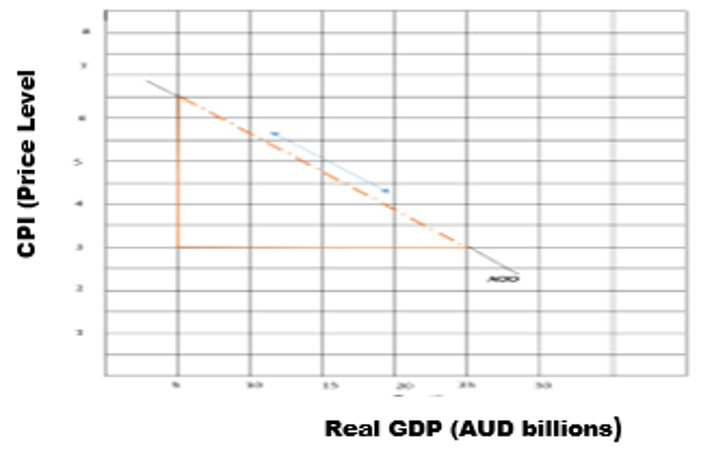
- The figure below indicates that the aggregate demand curve slopes left to right downwards. Explain the factors that account for the shape of the Aggregate demand curve.
Transcribed Image Text:40.00
35.00
30.00
DD
25.00
20.00
15.00
10.00
5.00
10
15
20
25
30
Labor supply (Millions)
Wage / hour (AUD)
Transcribed Image Text:Real GDP (AUD billions)
CPI (Price Level
Expert Solution
This question has been solved!
Explore an expertly crafted, step-by-step solution for a thorough understanding of key concepts.

Step by step
Solved in 3 steps

Knowledge Booster


Learn more about
Need a deep-dive on the concept behind this application? Look no further. Learn more about this topic, economics and related others by exploring similar questions and additional content below.Recommended textbooks for you


