In order to plot a graph of f(x)=z and g(y)=z in the same graph, with t as a parameter. The function used is mesh(z) O subplot(x,y,z) O plot(x,y,z) O plot3(x,y,z) O
In order to plot a graph of f(x)=z and g(y)=z in the same graph, with t as a parameter. The function used is mesh(z) O subplot(x,y,z) O plot(x,y,z) O plot3(x,y,z) O

Algebra & Trigonometry with Analytic Geometry
13th Edition
ISBN:9781133382119
Author:Swokowski
Publisher:Swokowski
Chapter5: Inverse, Exponential, And Logarithmic Functions
Section5.3: The Natural Exponential Function
Problem 56E

Related questions
Question
give correct option with explanation. don't give just direct option
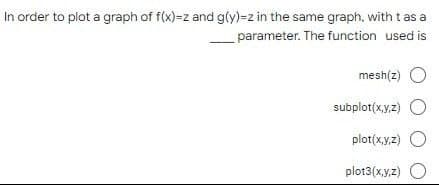
Transcribed Image Text:In order to plot a graph of f(x)=z and g(y)=z in the same graph, with t as a
parameter. The function used is
mesh(z) O
subplot(x,y,z) O
plot(x,y,z) O
plot3(x,y,z) O
Expert Solution
This question has been solved!
Explore an expertly crafted, step-by-step solution for a thorough understanding of key concepts.

Step by step
Solved in 2 steps

Recommended textbooks for you
Algebra & Trigonometry with Analytic Geometry
Algebra
ISBN:
9781133382119
Author:
Swokowski
Publisher:
Cengage


College Algebra (MindTap Course List)
Algebra
ISBN:
9781305652231
Author:
R. David Gustafson, Jeff Hughes
Publisher:
Cengage Learning
Algebra & Trigonometry with Analytic Geometry
Algebra
ISBN:
9781133382119
Author:
Swokowski
Publisher:
Cengage
College Algebra (MindTap Course List)
Algebra
ISBN:
9781305652231
Author:
R. David Gustafson, Jeff Hughes
Publisher:
Cengage Learning

College Algebra
Algebra
ISBN:
9781305115545
Author:
James Stewart, Lothar Redlin, Saleem Watson
Publisher:
Cengage Learning