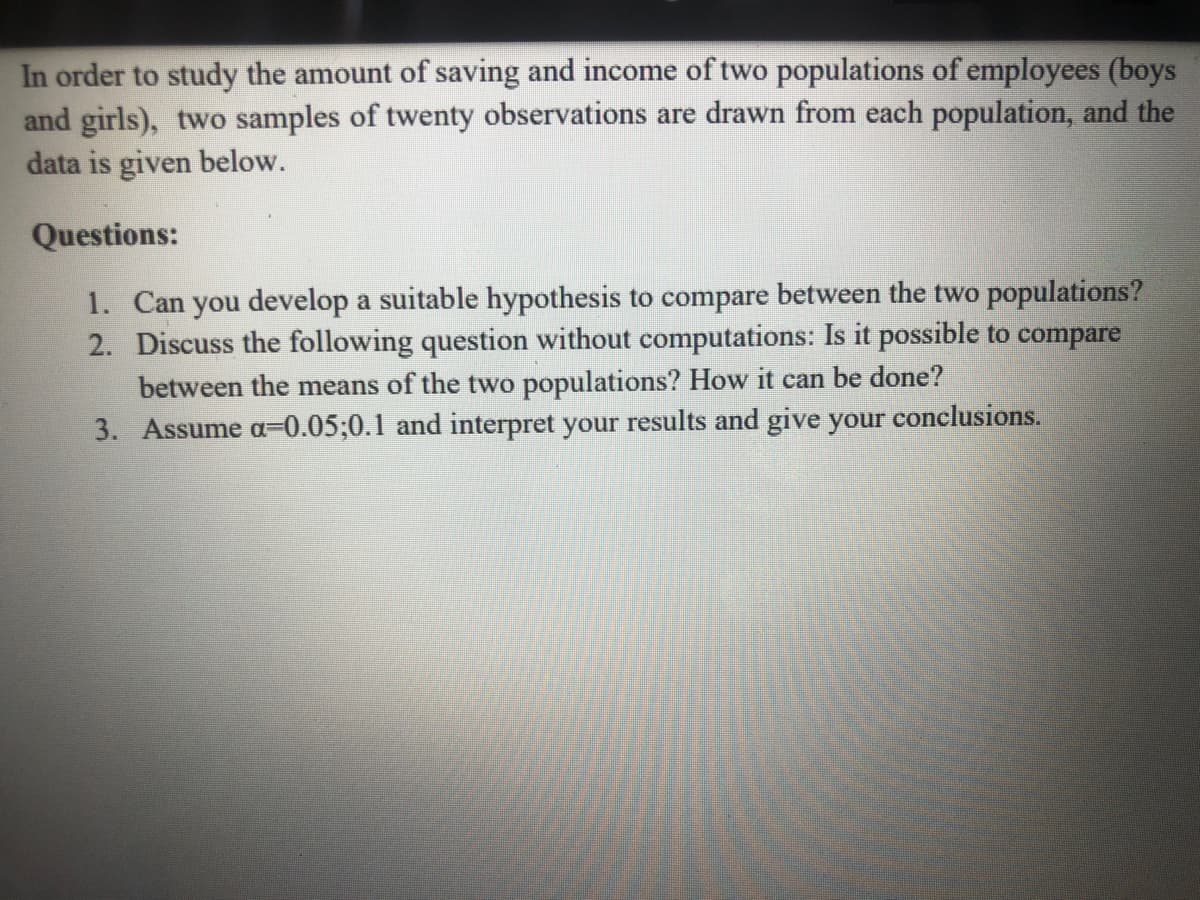
In order to study the amount of saving and income of two populations of employees (boys and girls), two samples of twenty observations are drawn from each population, and the data is given below. Questions: 1. Can you develop a suitable hypothesis to compare between the two populations? 2. Discuss the following question without computations: Is it possible to compare between the means of the two populations? How it can be done? 3. Assume a=0.05;0.1 and interpret your results and give your conclusions.
In order to study the amount of saving and income of two populations of employees (boys and girls), two samples of twenty observations are drawn from each population, and the data is given below. Questions: 1. Can you develop a suitable hypothesis to compare between the two populations? 2. Discuss the following question without computations: Is it possible to compare between the means of the two populations? How it can be done? 3. Assume a=0.05;0.1 and interpret your results and give your conclusions.

Linear Algebra: A Modern Introduction
4th Edition
ISBN:9781285463247
Author:David Poole
Publisher:David Poole
Chapter7: Distance And Approximation
Section7.3: Least Squares Approximation
Problem 31EQ

Related questions

Topic Video
Question
Transcribed Image Text:In order to study the amount of saving and income of two populations of employees (boys
and girls), two samples of twenty observations are drawn from each population, and the
data is given below.
Questions:
1. Can you develop a suitable hypothesis to compare between the two populations?
2. Discuss the following question without computations: Is it possible to compare
between the means of the two populations? How it can be done?
3. Assume a=0.05;0.1 and interpret your results and give your
conclusions.
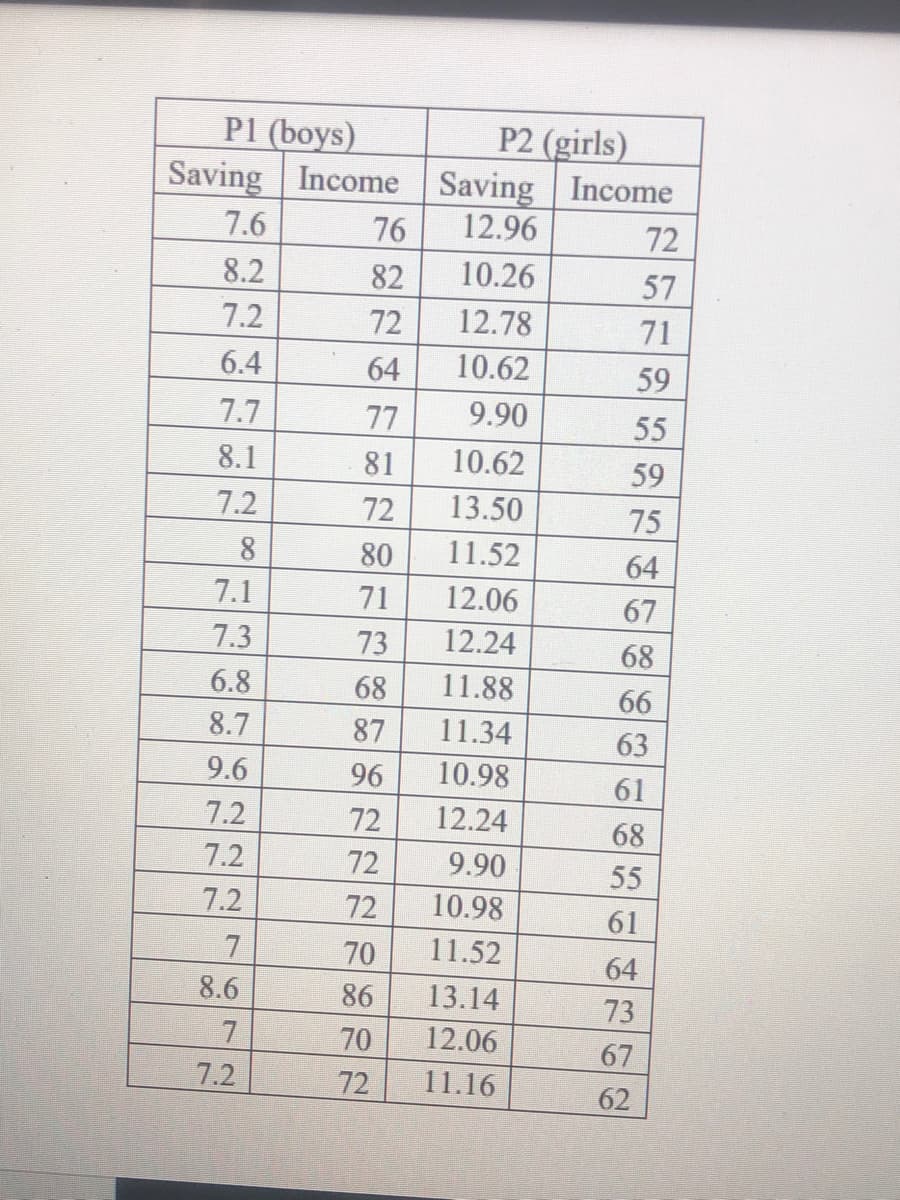
Transcribed Image Text:P1 (boys)
Saving Income Saving
P2 (girls)
Income
7.6
76
12.96
72
8.2
82
10.26
57
7.2
72
12.78
71
6.4
64
10.62
59
7.7
77
9.90
55
8.1
81
10.62
59
7.2
72
13.50
75
80
11.52
64
7.1
71
12.06
67
7.3
73
12.24
68
6.8
68
11.88
66
8.7
87
11.34
63
9.6
96
10.98
61
7.2
72
12.24
68
7.2
72
9.90
55
7.2
72
10.98
61
7
70
11.52
64
8.6
86
13.14
73
70
12.06
67
7.2
72
11.16
62
Expert Solution
This question has been solved!
Explore an expertly crafted, step-by-step solution for a thorough understanding of key concepts.

Step by step
Solved in 4 steps with 2 images

Knowledge Booster


Learn more about
Need a deep-dive on the concept behind this application? Look no further. Learn more about this topic, statistics and related others by exploring similar questions and additional content below.Recommended textbooks for you
Linear Algebra: A Modern Introduction
Algebra
ISBN:
9781285463247
Author:
David Poole
Publisher:
Cengage Learning
Linear Algebra: A Modern Introduction
Algebra
ISBN:
9781285463247
Author:
David Poole
Publisher:
Cengage Learning