The table below gives the number of seasons that each of the main six colors of Power Range appeared in. Number of Power Ranger Seasons Red 29 Blue 29 Yellow 27 Green 20 Pink 22 Black 20 Create a bar graph for this data and attach your file as a pdf, png, gif, or jpeg.
The table below gives the number of seasons that each of the main six colors of Power Range appeared in. Number of Power Ranger Seasons Red 29 Blue 29 Yellow 27 Green 20 Pink 22 Black 20 Create a bar graph for this data and attach your file as a pdf, png, gif, or jpeg.

Big Ideas Math A Bridge To Success Algebra 1: Student Edition 2015
1st Edition
ISBN:9781680331141
Author:HOUGHTON MIFFLIN HARCOURT
Publisher:HOUGHTON MIFFLIN HARCOURT
Chapter9: Solving Quadratic Functions
Section: Chapter Questions
Problem 4CA

Related questions
Question
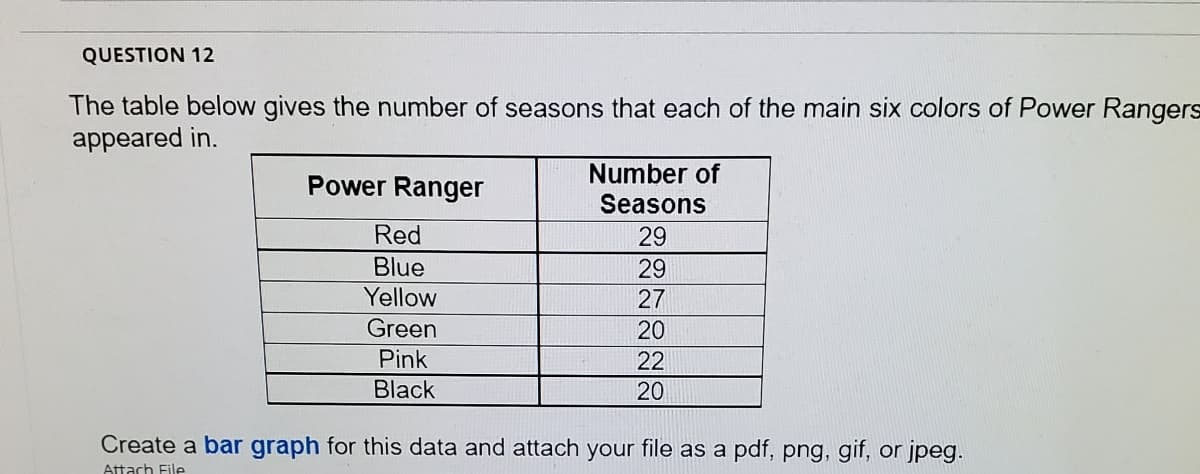
Transcribed Image Text:QUESTION 12
The table below gives the number of seasons that each of the main six colors of Power Rangers
appeared in.
Number of
Power Ranger
Seasons
Red
29
Blue
29
Yellow
27
Green
20
Pink
22
Black
20
Create a bar graph for this data and attach your file as a pdf, png, gif, or jpeg.
Attach File
Expert Solution
This question has been solved!
Explore an expertly crafted, step-by-step solution for a thorough understanding of key concepts.

This is a popular solution!

Trending now
This is a popular solution!

Step by step
Solved in 2 steps with 1 images

Recommended textbooks for you
Big Ideas Math A Bridge To Success Algebra 1: Stu…
Algebra
ISBN:
9781680331141
Author:
HOUGHTON MIFFLIN HARCOURT
Publisher:
Houghton Mifflin Harcourt

Glencoe Algebra 1, Student Edition, 9780079039897…
Algebra
ISBN:
9780079039897
Author:
Carter
Publisher:
McGraw Hill
Big Ideas Math A Bridge To Success Algebra 1: Stu…
Algebra
ISBN:
9781680331141
Author:
HOUGHTON MIFFLIN HARCOURT
Publisher:
Houghton Mifflin Harcourt
Glencoe Algebra 1, Student Edition, 9780079039897…
Algebra
ISBN:
9780079039897
Author:
Carter
Publisher:
McGraw Hill