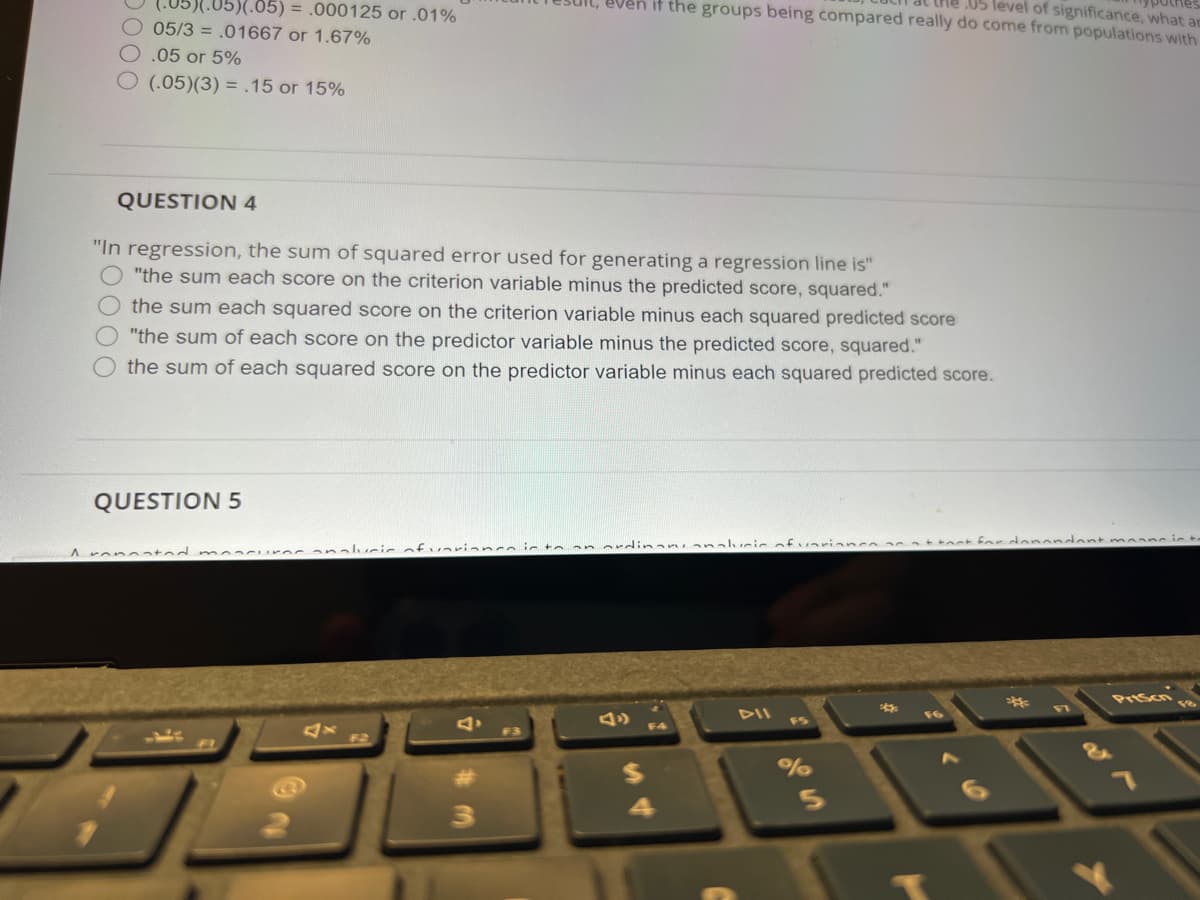
"In regression, the sum of squared error used for generating a regression line is"
Q: This regression line, Calculate the standard error of estimate for these data points.
A: Standard error of estimate is an important statistic to measure the accuracy of the predictions.
Q: earcher/experimenter to
A: first, what is regression analysis? it is a way of mathematically categorizing the data and out of…
Q: 1. Which assumption regarding the population residuals of linear regression models is necessary for…
A: According to guidelines i solve only first question if u want answer of second question send again…
Q: Identify three statistics that can be used as a basis for testing the utility of a regression.
A:
Q: Define the assumptions that inferential statistics in regression are based upon?
A: Solution: Regression is a technique that is used to estimate the dependent variable by using the one…
Q: Whta kind of plot is useful for deciding whether it is reasonable to find a regression plane for a…
A: Scatterplot matrix:It is a collection of scatterplots organized into a matrix. Each scatterplot…
Q: Discuss the importance of testing for serial correlation, multicollinearity and the significance of…
A: Serial correlation is used to explain the relationship among observed of the same variable over…
Q: Define Internal and External Validity When the Regression Is Used for Forecasting?
A: A statistical analysis has internal validity when the statistical inference regarding causal effects…
Q: What is the expected average height of 8 year old boys, using the regression equation?
A: From the given information, the obtained regression equation is y=27.84+2.573x.
Q: What is the sample regression equation (round to 2 decimal places)? y = + Education + Experience…
A: Regression equation is y=β0+β1Education+β2Experience+β3Age Here, β0=7.90, β1= 2.44, β2=0.54, β3= -…
Q: 1. Check whether the conditions for performing inference about the regression model are met. 2. What…
A: 1) A residual plot and a histogram of the residual are shown in the question. Thus, as we know that…
Q: Explain the process to Compute predicted scores from a regression equation?
A: Regression: Regression is a technique that is used to determine the relationship between two or more…
Q: What is A REGRESSION LINE?
A: A regression line is a line which is generally used to estimate a dependent or response variable…
Q: Explain, If the population regression function changes over time, then OLS estimates neglecting this…
A: Introduction: The multiple linear regression equation of the response variable, y, on k predictor…
Q: Explain Multivariate regression coefficients?
A: Independent and dependent variables in regression: In a simple regression, the variable of interest,…
Q: 4. What is the equation of the regression line? [Select] 5. Using the regression line model, predict…
A: Use the Excel and Perform the Regression. Followings are the Steps to perform the Regression 1) Open…
Q: approach is not used to analyzing the quality of the estimated regression lin
A: ANOVA is regression is used to to test the relationship between the variables under consideration.…
Q: How the most common use of a one-sided t-test is to determine whether a regression coefficient ?
A:
Q: Remove the outlier and compute the least-square regression line for predicting the president's age…
A: The least square regression line is given by, ŷ = bx+a Where b=…
Q: Explain why selecting a regression equation using stepwise regression is considered superior to…
A:
Q: In simple linear regression analysis, it is desired to test whether the regression coefficient is…
A: Solution: Given information: Test statistic t = 19 S.E(β1^)= 8 standard error of the regression…
Q: Explain the IV Regression Assumptions?
A: Introduction: A multiple regression analysis is often found to contain endogenous predictor…
Q: State the four conditions required for making regression inferences.
A:
Q: State true or false When a correlation coefficient for a linear regression model is close to -1 ,…
A: Given : Statement : When a correlation coefficient (corr. coeff.) for a linear regression(reg.)…
Q: What happens to the sum of the squared residuals as the data gets closer versus farther from the…
A: The sum of squared residuals is SSE = Σ(y - ŷ)2, where y is the actual value of the response…
Q: What is the interpretation of the slope beta1=-0.5 for the simple logistic regression with a…
A: The simple logistic regression model is a predictive algorithm using independent variables…
Q: What is a simple way to check for normality of residuals in a regression model?
A: First of all, testing of normality of residual is important for any regression model because it it…
Q: A confidence interval on the mean response in simple linear regression is always shorter at the…
A: Result: A confidence interval on the mean response in simple linear regression is always narrower at…
Q: Define "regression coefficient"?
A:
Q: Define regression line
A: Suppose ,we have 2 variables X and Y, out of which we want to know if there is any linear dependency…
Q: What is the standard error of estimate?
A:
Q: Calculate an estimate of the error standard deviation in the simple regression model
A: Given data, x y 112.3 75.2 97 70.7 92.7 57.9 86 48.5 102 73.9 99.2 73.3 95.8 68.1…
Q: Discuss the differences between an error and a residual.
A: Given : Two measures Error Residual
Q: 1. Sue is conducting a regression analysis to predict the amount of salaries expense using the…
A: This an example of multiple regression.
Q: Identify two graphs used in a residual analysis to check the Assumptions 1–3 for regression…
A:
Q: ) (i.e. test the hypothesis that all slope coefficients in the regression are zero). Test the…
A: In the question we are asked to test the significance of the given regression model nad test the…
Q: What are the Standard Errors for Fixed Effects Regression?
A:
Q: Explain the concept of Asymptotic Distribution of the OLS Estimatorand t-Statistic in the multi…
A: OLS is the Ordinary least square . Which is the most common estimation method for linear models and…
Q: The adjusted R-squared accounts for the amount of variance explained while also adjusting for the…
A: The adjusted R-squared accounts for the amount of variance explained while also adjusting for the…
Q: Explain about the least square regression line?
A:
Q: Explain how to determine the variance inflation factor (VIF) for a predictor variable x1 in a…
A:
Q: Using the regression line, we predict the final score of a student with a midterm score of 70 to be…
A:
Q: What are the predictive errors that will occur in regression line?
A:
Q: If the absolute value of regression coefficient of a predictor in SLR is more than that of…
A: The relation between original variable and added variable describe the attribute.
Q: If the coefficient of determination is 0.233, what percentage of the data about the regression line…
A: Coefficient of Determination: It is denoted by r2, here r represents the correlation between the two…
Q: In multiple regression analysis, residuals (Y- ) should be
A: Multiple linear regression (MLR) also known simply as multiple regression, is a statistical…
Q: suppose that you want to conduct a study on the relationship between women's shoe sizes and their…
A: Let X=women height. Y-women shoe size. given, X =64…
Q: П. 2. What is the degrees of freedom in a multiple regression model( with n values in each variable)…
A: The degrees of freedom for the t-test in a multiple regression model is known as follows: df=n-k-1.…
Q: What are the different measures used for the OLS estimate of the multiple regression line?
A: Multiple linear regression (MLR) is used among a number of random variables to determine the…
Trending now
This is a popular solution!
Step by step
Solved in 2 steps
- A hypothesis test on a regression coefficient fails to reject the null hypothesis at the 5% significance level. This means:True or False: Explain Suppose that OLS is unbiased for the following bivariate model: Y = B0 +B1X +u and suppose that the true slope coefficient B1 = 7. If you use the standard t-statistic to test the null hypothesis that the slope coefficient is equal to 0, the probability that you will reject the null hypothesis will increase if you reduce your sample size.A business school has a goal that the average number of years of work experience of its MBA applicants is more than three years. Historical data suggest that the variance has been constant at around six months, and thus, the population variance can be assumed to be know. Based on last years applications, it was found that among a sample of 47, the average number of years of work experience is 3.1. Can the school state emphatically that it is meeting its goal? Formulate the appropriate hypothesis test and conduct the test. What is the p-value associated with the appropriate hypothesis test for this problem?
- In a plot of bivariate data, several outliers appear outside the general pattern of data points and far from a fitted regression line. How would these outliers affect the correlation coefficient? A. There is not enough information to tell. B. It would make the correlation coefficient smaller because it pulls the best fitting line toward it, and away from the rest of the data. C. It would not affect the correlation coefficient at all. An outlier is not representative of the actual relationship so it should be disregarded. D. It would increase the correlation coefficient by making a stronger pattern appear in the data that was unknown before.Claudia’s bakery business has taken off. Her goods are so popular that she has decided to invest in kitchen equipment that will do some of the work for her. One machine in particular prepares bread dough, and it is set to measure 8 grams of yeast per loaf. Because baking requires precise measurements, she wants to test the new machine to make sure that the variance in the amounts of yeast per loaf is less than 0.31, at the 0.05 level of significance. A sample of the amounts of yeast added to the dough for 14 loaves has a variance of 0.12. Does this evidence support the claim that the new machine produces dough with a variance in the amounts of yeast per loaf of less than 0.31? Assume that the amounts of yeast per loaf are normally distributed. Step 1 of 3 : State the null and alternative hypotheses for the test. Fill in the blank below. H0: σ2=0.31 Ha: σ2⎯⎯⎯⎯⎯⎯⎯⎯⎯⎯⎯⎯⎯⎯⎯0.31Claudia’s bakery business has taken off. Her goods are so popular that she has decided to invest in kitchen equipment that will do some of the work for her. One machine in particular prepares bread dough, and it is set to measure 7 grams of yeast per loaf. Because baking requires precise measurements, she wants to test the new machine to make sure that the variance in the amounts of yeast per loaf is less than 0.27, at the 0.10 level of significance. A sample of the amounts of yeast added to the dough for 15 loaves has a variance of 0.17. Does this evidence support the claim that the new machine produces dough with a variance in the amounts of yeast per loaf of less than 0.27? Assume that the amounts of yeast per loaf are normally distributed. Step 3 of 3: Draw a conclusion and interpret the decision. 1. We reject the null hypothesis and conclude that there is sufficient evidence at a 0.10 level of significance that the variance in the amounts of yeast per loaf of less than…
- Claudia’s bakery business has taken off. Her goods are so popular that she has decided to invest in kitchen equipment that will do some of the work for her. One machine in particular prepares bread dough, and it is set to measure 7 grams of yeast per loaf. Because baking requires precise measurements, she wants to test the new machine to make sure that the variance in the amounts of yeast per loaf is less than 0.27, at the 0.10 level of significance. A sample of the amounts of yeast added to the dough for 15 loaves has a variance of 0.17. Does this evidence support the claim that the new machine produces dough with a variance in the amounts of yeast per loaf of less than 0.27? Assume that the amounts of yeast per loaf are normally distributed. Step 2 of 3 : Compute the value of the test statistic. Round your answer to three decimal places.Claudia’s bakery business has taken off. Her goods are so popular that she has decided to invest in kitchen equipment that will do some of the work for her. One machine in particular prepares bread dough, and it is set to measure 99 grams of yeast per loaf. Because baking requires precise measurements, she wants to test the new machine to make sure that the variance in the amounts of yeast per loaf is less than 0.32, at the 0.05 level of significance. A sample of the amounts of yeast added to the dough for 11 loaves has a variance of 0.18. Does this evidence support the claim that the new machine produces dough with a variance in the amounts of yeast per loaf of less than 0.32? Assume that the amounts of yeast per loaf are normally distributed. Step 1 of 3 : Step 1 of 3 : State the null and alternative hypotheses for the test. Fill in the blank below.Claudia’s bakery business has taken off. Her goods are so popular that she has decided to invest in kitchen equipment that will do some of the work for her. One machine in particular prepares bread dough, and it is set to measure 9 grams of yeast per loaf. Because baking requires precise measurements, she wants to test the new machine to make sure that the variance in the amounts of yeast per loaf is less than 0.32, at the 0.05 level of significance. A sample of the amounts of yeast added to the dough for 11 loaves has a variance of 0.18. Does this evidence support the claim that the new machine produces dough with a variance in the amounts of yeast per loaf of less than 0.32? Assume that the amounts of yeast per loaf are normally distributed. Step 3 of 3 : Draw a conclusion and interpret the decision.
- Claudia’s bakery business has taken off. Her goods are so popular that she has decided to invest in kitchen equipment that will do some of the work for her. One machine in particular prepares bread dough, and it is set to measure 9 grams of yeast per loaf. Because baking requires precise measurements, she wants to test the new machine to make sure that the variance in the amounts of yeast per loaf is less than 0.32, at the 0.05 level of significance. A sample of the amounts of yeast added to the dough for 11 loaves has a variance of 0.18. Does this evidence support the claim that the new machine produces dough with a variance in the amounts of yeast per loaf of less than 0.32? Assume that the amounts of yeast per loaf are normally distributed. Step 1 of 3 : State the null and alternative hypotheses for the test. Fill in the blank below.7. One of advantages of multiple regression is that it allows us to examine the effect of an exposure variable on the outcome variable while adjusting for no other variable in the model. A. TrueB. FalseC. None of the above 8. The particular method of analysis in a research study depends on: A. Research questionB. Study designC. Level of measurementD. All of the aboveE. A and B only 9. Reviewing relevant literature exposes the researcher to specific designs used by previous researchers. A. TrueB. FalseC. None of the aboveBecause sample variances are computed by dividing SS by n – 1, the average value of the sample variances from all possible random samples consistently _____ the population variance. underestimate overestimate equal Impossible to determine Which statement below is consistent with computing a weighted average of two individual samples? A computed weighted average will always be closer to the mean average of the larger sample than the mean average of the smaller sample. A computed weighted average will always be closer to the mean average of the smaller sample than the mean average of the larger sample. A weighted average will always equal the average of the two individual sample means. This cannot be determined from the information provided.