In retail, a store manager uses time series models to understand shopping trends. Review the scatter plot of the store’s sales from 2010 through 2021 to answer the questions. See attached as image. Here is the data for Fiscal Year and Sales: Fiscal Year Sales 2010 $260,123.00 2011 $256,853.00 2012 $274,366.00 2013 $290,525.00 2014 $322,318.00 2015 $380,921.00 2016 $541,925.00 2017 $909,050.00 2018 $1,817,521.00 2019 $3,206,564.00 2020 $4,921,005.00 2021 $5,686,338.00 Time series decomposition seeks to separate the time series (Y) into 4 components: trend (T), cycle (C), seasonal (S), and irregular (I). What is the difference between these components? The model can be additive or multiplicative. When do you use each? Review the scatter plot of the exponential trend of the time series data. Do you observe a trend? If so, what type of trend do you observe? What predictions might you make about the store’s annual sales over the next few years?
In retail, a store manager uses time series models to understand shopping trends. Review the scatter plot of the store’s sales from 2010 through 2021 to answer the questions. See attached as image. Here is the data for Fiscal Year and Sales: Fiscal Year Sales 2010 $260,123.00 2011 $256,853.00 2012 $274,366.00 2013 $290,525.00 2014 $322,318.00 2015 $380,921.00 2016 $541,925.00 2017 $909,050.00 2018 $1,817,521.00 2019 $3,206,564.00 2020 $4,921,005.00 2021 $5,686,338.00 Time series decomposition seeks to separate the time series (Y) into 4 components: trend (T), cycle (C), seasonal (S), and irregular (I). What is the difference between these components? The model can be additive or multiplicative. When do you use each? Review the scatter plot of the exponential trend of the time series data. Do you observe a trend? If so, what type of trend do you observe? What predictions might you make about the store’s annual sales over the next few years?

Algebra & Trigonometry with Analytic Geometry
13th Edition
ISBN:9781133382119
Author:Swokowski
Publisher:Swokowski
Chapter9: Systems Of Equations And Inequalities
Section: Chapter Questions
Problem 32RE

Related questions
Question
100%
In retail, a store manager uses time series models to understand shopping trends.
Review the
Here is the data for Fiscal Year and Sales:
| Fiscal Year | Sales |
| 2010 | $260,123.00 |
| 2011 | $256,853.00 |
| 2012 | $274,366.00 |
| 2013 | $290,525.00 |
| 2014 | $322,318.00 |
| 2015 | $380,921.00 |
| 2016 | $541,925.00 |
| 2017 | $909,050.00 |
| 2018 | $1,817,521.00 |
| 2019 | $3,206,564.00 |
| 2020 | $4,921,005.00 |
| 2021 | $5,686,338.00 |
- Time series decomposition seeks to separate the time series (Y) into 4 components: trend (T), cycle (C), seasonal (S), and irregular (I). What is the difference between these components?
- The model can be additive or multiplicative. When do you use each?
- Review the scatter plot of the exponential trend of the time series data. Do you observe a trend? If so, what type of trend do you observe?
- What predictions might you make about the store’s annual sales over the next few years?
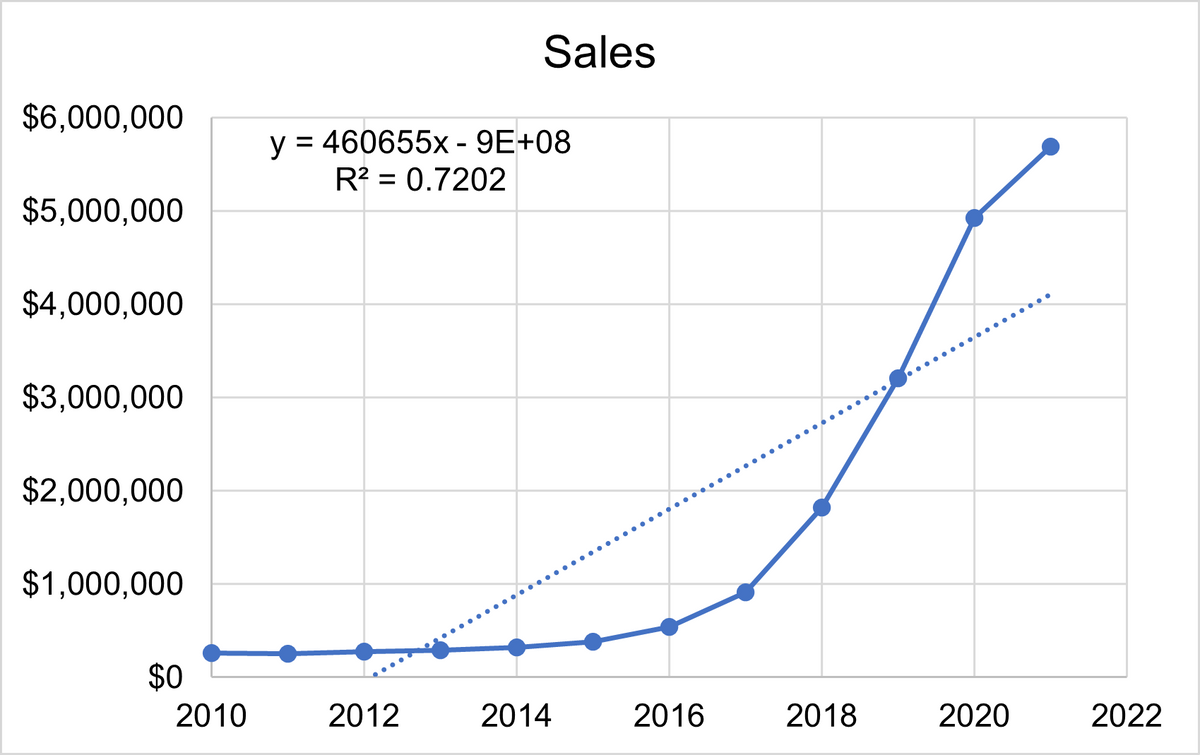
Transcribed Image Text:$6,000,000
$5,000,000
$4,000,000
$3,000,000
$2,000,000
$1,000,000
$0
2010
Sales
y = 460655x - 9E+08
R² = 0.7202
2012
2014
2016
2018
2020
2022
Expert Solution
This question has been solved!
Explore an expertly crafted, step-by-step solution for a thorough understanding of key concepts.

This is a popular solution!
Step 1: Write the given information.
VIEWStep 2: Explain the difference between 4 components.
VIEWStep 3: Write the situation where the additive or multiplicative are used.
VIEWStep 4: Determine the type of trend if observed.
VIEWStep 5: Make the predictions about the store’s annual sales over the next few years.
VIEWSolution
VIEW
Trending now
This is a popular solution!

Step by step
Solved in 6 steps with 6 images

Recommended textbooks for you
Algebra & Trigonometry with Analytic Geometry
Algebra
ISBN:
9781133382119
Author:
Swokowski
Publisher:
Cengage


Algebra and Trigonometry (MindTap Course List)
Algebra
ISBN:
9781305071742
Author:
James Stewart, Lothar Redlin, Saleem Watson
Publisher:
Cengage Learning
Algebra & Trigonometry with Analytic Geometry
Algebra
ISBN:
9781133382119
Author:
Swokowski
Publisher:
Cengage
Algebra and Trigonometry (MindTap Course List)
Algebra
ISBN:
9781305071742
Author:
James Stewart, Lothar Redlin, Saleem Watson
Publisher:
Cengage Learning