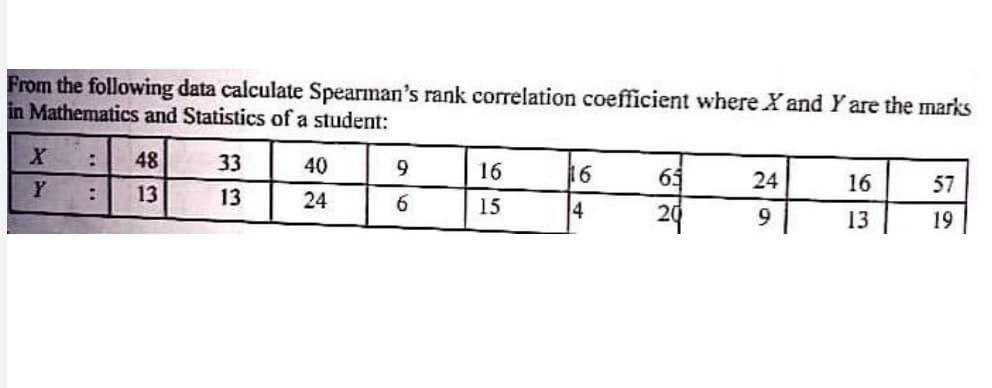
From the following data calculate Spearman's rank correlation coefficient where X and Y are the marks in Mathematics and Statistics of a student: 48 33 40 9. 16 16 65 24 16 57 Y 13 13 24 6 15 14 29 9 13 19


Q: Two groups of children, one belonging to the professional class, 125 in number, and the other belong...
A:
Q: It has been observed that the average number of traffic accidents requiring medical assistance on th...
A: A random variable is a variable whose values depend on outcomes of a random experiment. It is identi...
Q: A person drives for 200 kilometres at a speed of 30 k.p.h. He drives another 200 kilometres at a spe...
A:
Q: described by the following Venn diagram A C O a. A - (B - C) O b. A - C O c (A - B) -C Od (A - c) - ...
A: We want to tell you which one is the correct choice.
Q: A statistical study of 520 high school seniors showed that they gained an average of x = 11 points i...
A: Given Data : Sample Size, n = 520 Sample Mean, x̄ = 11 standard deviat...
Q: A simple random sample of size n=300individuals who are currently employed is asked if they work at ...
A:
Q: Completely identify the following: Но: На: Decision Rule: Computed p-value: Decision: Conclusion:
A: Heifer calves are essential to the success of a dairy farm because they serve as replacements to lac...
Q: Explain how hypotheses are generated. What sort of evidence is logically required to generate an hyp...
A: Please find the explanation below. Thank you
Q: Example:. For the following data obtain: ) mean, (ii) median, (iii) mean deviation from median, and ...
A: Solution is given:
Q: Example 3.8. Forx = 1,2,3 and y = 1, 2, let the joint pmf of X and Y be defined by I+y fx,y(r, y) = ...
A: XY X=1 X=2 X=3 Total Y=1 2/21 3/21 4/21 9/21 Y=2 3/21 4/21 5/21 12/21 Total 5/21 7/21 9/21 1
Q: Mean height of male workers is 70 inches and the S.D. is 2.9 inches. The corresponding numbers for f...
A:
Q: 2 Define the random variable, its distribution, and compute for the variable/measure that is being...
A: Given Chane of striking oil = 20%
Q: The histogram below gives the length of service of members of the Department of Chemistry at a parti...
A: Given:
Q: n admissions director wants to estimate the mean age of all students enrolled at a college. The est...
A: Given: E = 1.7
Q: Consider a t distribution with 3 degrees of freedom. Compute P(-1.12<t<1.12). Please show your work.
A:
Q: The following data give the numbers of orders received for a sample of 30 items at the time saver ma...
A: Since you have posted a question with multiple subparts, we will solve first three subparts for you....
Q: What is the type of the variable "The names of Kuwaiti hotels"? O a. Qualitative Nominal O b. Quanti...
A: What is the type of the variable The names of Kuwaiti hotels .
Q: In a factory, two machines are serving 10 parts per hour. Parts arrive at the rate of 12 per hour wh...
A:
Q: is a graph showing the number of observations in each class of a frequency distribution. O a. histog...
A: We have given that an blank statement about to the graph. We need to find out that type of graph tha...
Q: Consider a block of radio-active metal with a "half-life" of 1 day. Roughly speaking, this neans tha...
A:
Q: Question: T-tests are widely used in public health research. Please list one scenario that a two-sa...
A: If we have to check the effectiveness of certain treatment in cure of certain disease, then we divid...
Q: Еxample Calculate the Harmonic Mean of the following series: Values : 2 10 14 18 Frequency : 4 12 20...
A:
Q: Can you describe the normal curve and explain why the normal curve in real-life distributions will n...
A: Normal distribution: A normal distribution is the proper term for a probability bell curve. In a no...
Q: Assume that hybridization experiments are conducted with peas having the property that for? offsprin...
A: Given: n = 20 p = 0.75
Q: Construct Quantity Index Numbers from the following data, applying: i) Laspeyre's Formula ii) Paasch...
A:
Q: Use the standard normal table to find the z-score that corresponds to the given percentile. If the a...
A: Required probability is P(Z<z0)=0.48
Q: 4. You plan to develop a new software system that you believe will surpass the success of Google and...
A: Given that -You plan to develop a new software system that you believe will surpass the success of G...
Q: You are interested in testing if there is an association between marital status (married vs. never m...
A: From the provided information, We are interested in testing whether there is any association between...
Q: You wish to test the following claim (HaHa) at a significance level of α=0.02α=0.02. Ho:μ=80....
A:
Q: A zoologist spent 70 days studying how often a slow loris is sighted per day in a particular forest....
A: The Chi square χ2 good ness of fit test is used to determine whether the observed distribution is eq...
Q: A sports writer wished to see if a football filled with helium travels farther, on average, than a f...
A: The p value are used to measure the significance difference the sample and population. We can also d...
Q: Please answer #4 and #5
A: Given : For sample 1 x̄1 = 3.2 s1 = 1.1 n1 = 55 For Sample 2 x̄2 = 3...
Q: One of the assumptions of one-sample t-test is that the dependent variable and the independent varia...
A: We have given that the statement about to the one sample t-test. We need to find out that the given ...
Q: Determine and o, from the given parameters of the population and sample size. µ = 76, o = 32, n = 64...
A:
Q: The graph of the waiting time (in seconds) at a red light is shown below on the left with its mean a...
A: For the given data, Graph most closely resembles the sampling distribution of the sample means, beca...
Q: You wish to test the following claim (HaHa) at a significance level of α=0.02α=0.02. Ho:μ=70....
A: Assume that μ is the population mean.
Q: The specifications for a certain quality characteristic are (60 + 24) in coded val- ues. The table g...
A:
Q: ) Suppose you run the regression: y = Bo + B1x1 + B2x2 + u, where the error term u satisfies the Gau...
A: Ordinary Least Square Assumptions are given as a true regression model and the data generating proce...
Q: 0.56 ppm is the maximum authorized concentration of phosphate in drinking water. Given below is the ...
A: (a): The 95% confidence interval is given as [0.32 - 0.49] so we can say that there is outlier prese...
Q: .ccording to the below table, calculate the weighted mean. Frequency 2 5 Number of Laptops 1 2 3 4 O...
A: For the given data Find Weighted mean = ?
Q: Solve and show your steps: The mean, standard deviation and range of a symmetrical distribution of w...
A: Given Mean=μ=40,n=20, standard deviation=σ=5,range=6
Q: anic sells a brand of automobile tire that has a life expectancy that is normally distributee cee fo...
A: Given Mean=36000 Standard deviations=2600 Z=-1.282
Q: You are conducting a study to see if the probability of a true negative on a test for a certain canc...
A:
Q: In a study of government financial aid for college students, it becomes necessary to estimate the p...
A: formula for the sample size :
Q: ne of the requirements of for using independent samples t-test is that the dependent variable must b...
A:
Q: Find the probability of the Binomials given. 9. In a history class, Colin and Diana both write a mul...
A: See the attachment...............
Q: J-ALLEN TECH is offering a television set for $9,000.00 on Hire Purchase. It can be bought by making...
A:
Q: A statistical study of 430 high school seniors gained an average of x = 15 points in their second at...
A: A Confidence Interval is a range of numbers within which we are reasonably certain our true populati...
Q: Years of Experience Salesperson Annual Sales ($1,000s) 80 2. 97 102 4 107 6. 103 101 10 119 10 128 9...
A: Solution: The estimated regression equation is y^= 82+4x
Q: The values of sample mean X and sample standard deviation s for 15 samples. each of size 4, drawn fr...
A:

Step by step
Solved in 3 steps

- From the data of the following table: Calculate Spearman's rank correlation coefficient between x and y and determine its type. sUse the following table to find the linear correlation coefficient between x and y x112432y311234Compute r, the correlation coefficient, using the following data. x 1 5 3 6 4 7 y 7 3 6 3 4 2 R =(Round to three decimal places.)
- Listed below are the overhead widths (in cm) of seals measured from photographs and the weights (in kg) of the seals. Construct a scatterplot, find the value of the linear correlation coefficient r, and find the critical values of r using α=0.01. Is there sufficient evidence to conclude that there is a linear correlation between overhead widths of seals from photographs and the weights of the seals? Overhead Width 7.1 7.6 9.7 9.4 8.8 8.2 Weight 111 198 246 204 202 185 Construct a scatterplot. Choose the correct graph below. (inserted as picture) The linear correlation coefficient is r=__________ (Round to three decimal places as needed.) The critical values are r= (_______,________) (Round to three decimal places as needed. Use a comma to separate answers as needed.) Because the absolute value of the linear correlation coefficient is (greater,less than, equal to) than the positive…The following table shows the magnitude of earthquakes on the Richter scale, x, and the corresponding depth of the earthquakes (in kilometers) below the surface at the epicenter of the earthquake. Find the correlation coefficient of the following pairs of data: x = earthquake magnitude 2.9 4.2 3.3 4.5 2.6 3.2 3.4 y = depth of earthquake (in km) 5 10 11.2 10 7.9 3.9 5.5Listed below are the overhead widths (in cm) of seals measured from photographs and the weights (in kg) of the seals. Construct a scatterplot, find the value of the linear correlation coefficient r, and find the critical values of r using α=0.01. Is there sufficient evidence to conclude that there is a linear correlation between overhead widths of seals from photographs and the weights of the seals? Overhead Width 7.1 7.5 9.6 9.3 8.7 8.2 Weight 115 193 237 196 198 186
- Listed below are the overhead widths (in cm) of seals measured from photographs and the weights (in kg) of the seals. Construct a scatterplot, find the value of the linear correlation coefficient r, and find the critical values of r using α=0.01. Overhead width overhead weight 7.1 111 7.6 164 9.8 250 9.2 192 8.8 205 8.2 183 Is there sufficient evidence to conclude that there is a linear correlation between overhead widths of seals from photographs and the weights of the seals? The linear correlation coefficient is r=? (Round to three decimal places as needed.) The linear correlation coefficient is r=? (Round to three decimal places as needed.) The critical values are r=? (Round to three decimal places as needed. Use a comma to separate answers as needed.) Because the absolute value of the linear correlation coefficient is ______ than the positive critical value, there _______ sufficient evidence to support the claim that there is a linear…Listed below are the overhead widths (in cm) of seals measured from photographs and the weights (in kg) of the seals. Construct a scatterplot, find the value of the linear correlation coefficient r, and find the critical values of r using α=0.01. Is there sufficient evidence to conclude that there is a linear correlation between overhead widths of seals from photographs and the weights of the seals? Overhead Width 7.1 7.7 9.7 9.4 8.7 8.3 Weight 111 201 242 204 197 192 Construct a scatterplot. Choose the correct graph below. The linear correlation coefficient is r=enter your response here. (Round to three decimal places as needed.) The critical values are r=enter your response here. (Round to three decimal places as needed. Use a comma to separate answers as needed.)With the following data in 6 cities, calculate the coefficient of correlation by Pearson’s method between the density of population and death rate:Cities ABCDEF Area in sq. kilometre 150 Population in ‘000’ 30 No. of Deaths 300180 100 60 120 80 9040427224 1440 560 840 1224 312