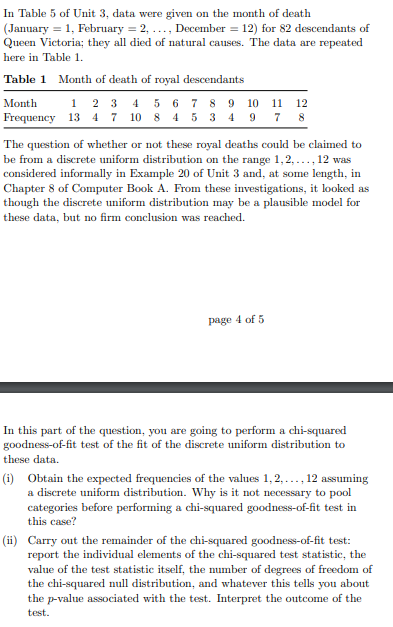
In Table 5 of Unit 3, data were given on the month of death (January = 1, February = 2, ..., December = 12) for 82 descendants of Queen Victoria; they all died of natural causes. The data are repeated here in Table 1. Table 1 Month of death of royal descendants 1 2 3 4 5 6 7 8 9 10 11 12 Frequency 13 4 7 10 8 4 5 3 4 9 7 8 Month The question of whether or not these royal deaths could be claimed to be from a discrete uniform distribution on the range 1,2,..., 12 was considered informally in Example 20 of Unit 3 and, at some length, in Chapter 8 of Computer Book A. From these investigations, it looked as though the discrete uniform distribution may be a plausible model for these data, but no firm conclusion was reached. page 4 of 5 In this part of the question, you are going to perform a chi-squared goodness-of-fit test of the fit of the discrete uniform distribution to these data. (i) Obtain the expected frequencies of the values 1,2,..., 12 assuming a discrete uniform distribution. Why is it not necessary to pool categories before performing a chi-squared goodness-of-fit test in this case? (ii) Carry out the remainder of the chi-squared goodness-of-fit test: report the individual elements of the chi-squared test statistic, the value of the test statistic itself, the number of degrees of freedom of the chi-squared null distribution, and whatever this tells you about the p-value associated with the test. Interpret the outcome of the test.
In Table 5 of Unit 3, data were given on the month of death (January = 1, February = 2, ..., December = 12) for 82 descendants of Queen Victoria; they all died of natural causes. The data are repeated here in Table 1. Table 1 Month of death of royal descendants 1 2 3 4 5 6 7 8 9 10 11 12 Frequency 13 4 7 10 8 4 5 3 4 9 7 8 Month The question of whether or not these royal deaths could be claimed to be from a discrete uniform distribution on the range 1,2,..., 12 was considered informally in Example 20 of Unit 3 and, at some length, in Chapter 8 of Computer Book A. From these investigations, it looked as though the discrete uniform distribution may be a plausible model for these data, but no firm conclusion was reached. page 4 of 5 In this part of the question, you are going to perform a chi-squared goodness-of-fit test of the fit of the discrete uniform distribution to these data. (i) Obtain the expected frequencies of the values 1,2,..., 12 assuming a discrete uniform distribution. Why is it not necessary to pool categories before performing a chi-squared goodness-of-fit test in this case? (ii) Carry out the remainder of the chi-squared goodness-of-fit test: report the individual elements of the chi-squared test statistic, the value of the test statistic itself, the number of degrees of freedom of the chi-squared null distribution, and whatever this tells you about the p-value associated with the test. Interpret the outcome of the test.

Algebra & Trigonometry with Analytic Geometry
13th Edition
ISBN:9781133382119
Author:Swokowski
Publisher:Swokowski
Chapter10: Sequences, Series, And Probability
Section10.8: Probability
Problem 30E

Related questions
Question
Stats 2b
Transcribed Image Text:In Table 5 of Unit 3, data were given on the month of death
(January = 1, February = 2, ..., December = 12) for 82 descendants of
Queen Victoria; they all died of natural causes. The data are repeated
here in Table 1.
Table 1 Month of death of royal descendants
1 2 3 4 5 6 7 8 9 10 11 12
7 8
Month
Frequency 13 4 7 10 8 4 5 3 4 9
The question of whether or not these royal deaths could be claimed to
be from a discrete uniform distribution on the range 1,2,..., 12 was
considered informally in Example 20 of Unit 3 and, at some length, in
Chapter 8 of Computer Book A. From these investigations, it looked as
though the discrete uniform distribution may be a plausible model for
these data, but no firm conclusion was reached.
page 4 of 5
In this part of the question, you are going to perform a chi-squared
goodness-of-fit test of the fit of the discrete uniform distribution to
these data.
(i) Obtain the expected frequencies of the values 1,2,..., 12 assuming
a discrete uniform distribution. Why is it not necessary to pool
categories before performing a chi-squared goodness-of-fit test in
this case?
(ii) Carry out the remainder of the chi-squared goodness-of-fit test:
report the individual elements of the chi-squared test statistic, the
value of the test statistic itself, the number of degrees of freedom of
the chi-squared null distribution, and whatever this tells you about
the p-value associated with the test. Interpret the outcome of the
test.
Expert Solution
This question has been solved!
Explore an expertly crafted, step-by-step solution for a thorough understanding of key concepts.

Step by step
Solved in 4 steps

Recommended textbooks for you
Algebra & Trigonometry with Analytic Geometry
Algebra
ISBN:
9781133382119
Author:
Swokowski
Publisher:
Cengage
Algebra & Trigonometry with Analytic Geometry
Algebra
ISBN:
9781133382119
Author:
Swokowski
Publisher:
Cengage