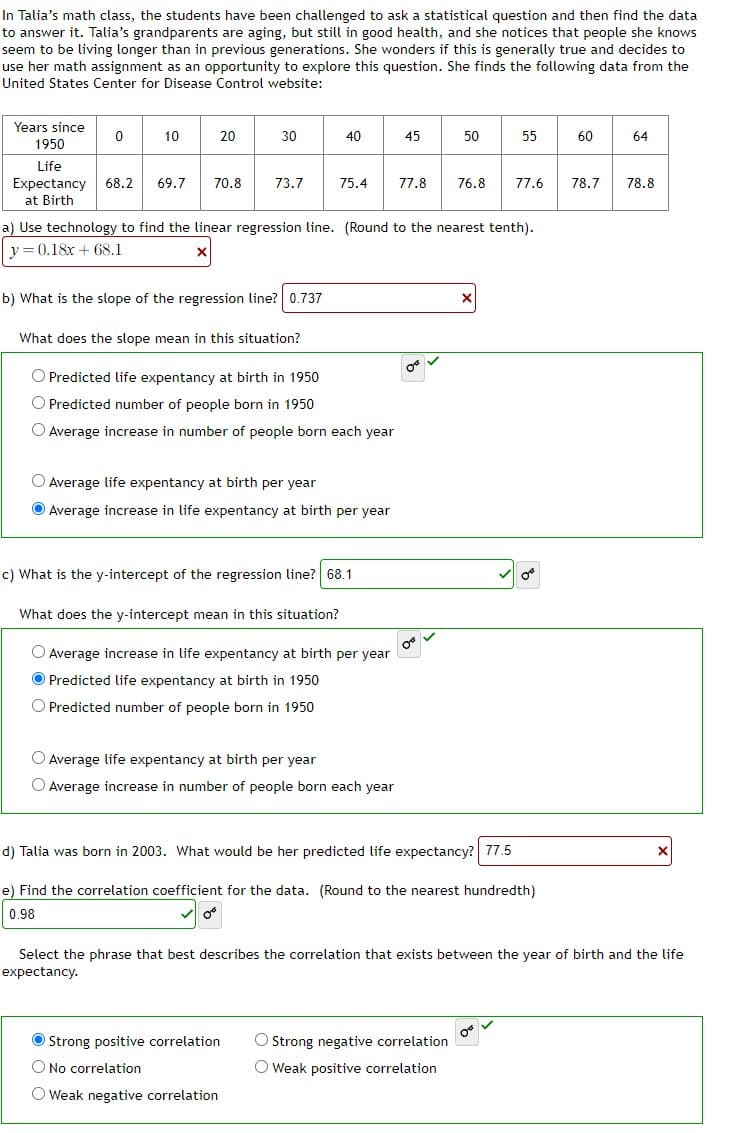
In Talia's math class, the students have been challenged to ask a statistical question and then find the data to answer it. Talia's grandparents are aging, but still in good health, and she notices that people she knows seem to be living longer than in previous generations. She wonders if this is generally true and decides to use her math assignment as an opportunity to explore this question. She finds the following data from the United States Center for Disease Control website: Years since 1950 Life Expectancy 68.2 69.7 70.8 73.7 at Birth 0 10 20 30 b) What is the slope of the regression line? 0.737 40 What does the slope mean in this situation? O Predicted life expentancy at birth in 1950 O Predicted number of people born in 1950 O Average increase in number of people born each year a) Use technology to find the linear regression line. (Round to the nearest tenth). y = 0.18x + 68.1 O Average life expentancy at birth per year Average increase in life expentancy at birth per year c) What is the y-intercept of the regression line? 68.1 45 Strong positive correlation O No correlation O Weak negative correlation 75.4 77.8 76.8 77.6 78.7 78.8 What does the y-intercept mean in this situation? OF O Average increase in life expentancy at birth per year Ⓒ Predicted life expentancy at birth in 1950 O Predicted number of people born in 1950 O Average life expentancy at birth per year O Average increase in number of people born each year 50 55 d) Talia was born in 2003. What would be her predicted life expectancy? 77.5 e) Find the correlation coefficient for the data. (Round to the nearest hundredth) 0.98 O Strong negative correlation O Weak positive correlation 0 0° 60 Select the phrase that best describes the correlation that exists between the year of birth and the life expectancy. 64
In Talia's math class, the students have been challenged to ask a statistical question and then find the data to answer it. Talia's grandparents are aging, but still in good health, and she notices that people she knows seem to be living longer than in previous generations. She wonders if this is generally true and decides to use her math assignment as an opportunity to explore this question. She finds the following data from the United States Center for Disease Control website: Years since 1950 Life Expectancy 68.2 69.7 70.8 73.7 at Birth 0 10 20 30 b) What is the slope of the regression line? 0.737 40 What does the slope mean in this situation? O Predicted life expentancy at birth in 1950 O Predicted number of people born in 1950 O Average increase in number of people born each year a) Use technology to find the linear regression line. (Round to the nearest tenth). y = 0.18x + 68.1 O Average life expentancy at birth per year Average increase in life expentancy at birth per year c) What is the y-intercept of the regression line? 68.1 45 Strong positive correlation O No correlation O Weak negative correlation 75.4 77.8 76.8 77.6 78.7 78.8 What does the y-intercept mean in this situation? OF O Average increase in life expentancy at birth per year Ⓒ Predicted life expentancy at birth in 1950 O Predicted number of people born in 1950 O Average life expentancy at birth per year O Average increase in number of people born each year 50 55 d) Talia was born in 2003. What would be her predicted life expectancy? 77.5 e) Find the correlation coefficient for the data. (Round to the nearest hundredth) 0.98 O Strong negative correlation O Weak positive correlation 0 0° 60 Select the phrase that best describes the correlation that exists between the year of birth and the life expectancy. 64

Functions and Change: A Modeling Approach to College Algebra (MindTap Course List)
6th Edition
ISBN:9781337111348
Author:Bruce Crauder, Benny Evans, Alan Noell
Publisher:Bruce Crauder, Benny Evans, Alan Noell
Chapter5: A Survey Of Other Common Functions
Section5.3: Modeling Data With Power Functions
Problem 6E: Urban Travel Times Population of cities and driving times are related, as shown in the accompanying...

Related questions
Question
Transcribed Image Text:In Talia's math class, the students have been challenged to ask a statistical question and then find the data
to answer it. Talia's grandparents are aging, but still in good health, and she notices that people she knows
seem to be living longer than in previous generations. She wonders if this is generally true and decides to
use her math assignment as an opportunity to explore this question. She finds the following data from the
United States Center for Disease Control website:
Years since
1950
Life
Expectancy
at Birth
0
10
20
30
68.2 69.7 70.8 73.7
b) What is the slope of the regression line? 0.737
40
75.4
What does the slope mean in this situation?
O Predicted life expentancy at birth in 1950
O Predicted number of people born in 1950
O Average increase in number of people born each year
O Average life expentancy at birth per year
Average increase in life expentancy at birth per year
a) Use technology to find the linear regression line. (Round to the nearest tenth).
y = 0.18x + 68.1
c) What is the y-intercept of the regression line? 68.1
What does the y-intercept mean in this situation?
O Average increase in life expentancy at birth per year
Ⓒ Predicted life expentancy at birth in 1950
O Predicted number of people born in 1950
Strong positive correlation
O No correlation
O Weak negative correlation
O Average life expentancy at birth per year
O Average increase in number of people born each year
45
50
77.8 76.8 77.6
0⁰
55
d) Talia was born in 2003. What would be her predicted life expectancy? 77.5
e) Find the correlation coefficient for the data. (Round to the nearest hundredth)
0.98
O Strong negative correlation
O Weak positive correlation
0
60
64
Select the phrase that best describes the correlation that exists between the year of birth and the life
expectancy.
78.7 78.8
Expert Solution
This question has been solved!
Explore an expertly crafted, step-by-step solution for a thorough understanding of key concepts.

This is a popular solution!
Step 1: Mention the given data
VIEWStep 2: Compute the linear regression line
VIEWStep 3: State the slope of regression line and its interpretation
VIEWStep 4: State the y-intercept of regression line and its interpretation
VIEWStep 5: Compute predicted life expectancy at birth of year 2003
VIEWStep 6: Compute the correlation coefficient
VIEWSolution
VIEW
Trending now
This is a popular solution!

Step by step
Solved in 7 steps with 15 images

Recommended textbooks for you
Functions and Change: A Modeling Approach to Coll…
Algebra
ISBN:
9781337111348
Author:
Bruce Crauder, Benny Evans, Alan Noell
Publisher:
Cengage Learning

Glencoe Algebra 1, Student Edition, 9780079039897…
Algebra
ISBN:
9780079039897
Author:
Carter
Publisher:
McGraw Hill
Functions and Change: A Modeling Approach to Coll…
Algebra
ISBN:
9781337111348
Author:
Bruce Crauder, Benny Evans, Alan Noell
Publisher:
Cengage Learning
Glencoe Algebra 1, Student Edition, 9780079039897…
Algebra
ISBN:
9780079039897
Author:
Carter
Publisher:
McGraw Hill