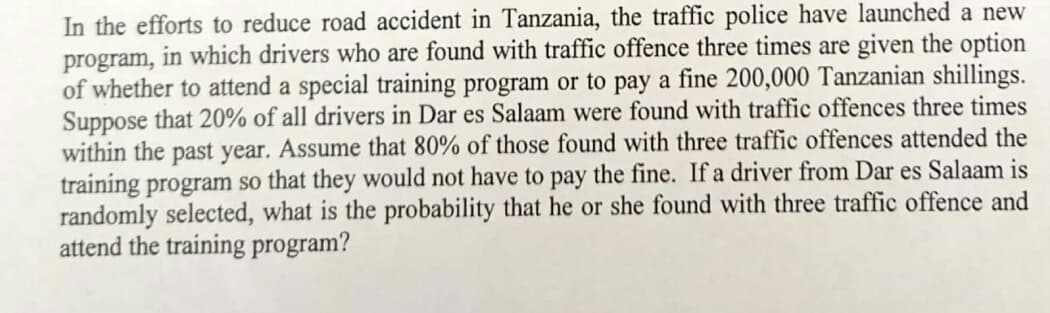
In the efforts to reduce road accident in Tanzania, the traffic police have launched a new program, in which drivers who are found with traffic offence three times are given the option of whether to attend a special training program or to pay a fine 200,000 Tanzanian shillings. Suppose that 20% of all drivers in Dar es Salaam were found with traffic offences three times within the past year. Assume that 80% of those found with three traffic offences attended the training program so that they would not have to pay the fine. If a driver from Dar es Salaam is randomly selected, what is the probability that he or she found with three traffic offence and attend the training program?
Q: (12) A survey of enrollment at 35 community colleges across the United States yielded the following…
A: Given: Sample size = n = 35 Given data is 6414 1550 2109 9350 21828 4300 5944 5722 2825 2044 5481…
Q: The following contingency table shows the approximate number of households with a particular number…
A:
Q: Study is conducted involving 14 infants to investigate the association between gestational age at…
A: Correlation is used to find the association between two variables which can be obtained using excel…
Q: A random sample of n1 = 10 regions in New England gave the following violent crime rates (per…
A: The sample statistics for the two samples is calculated using Excel software: Enter the data into…
Q: A random sample of n1 = 10 regions in New England gave the following violent crime rates (per…
A: Given x1:new england crime rate x2 rocky mountain crime rate 3.3 3.9 3.9 4.1 4.2 4.5 4.1…
Q: According to the IRS, individuals filing federal income tax returns prior to March 31 received an…
A: Null Hypothesis: A hypothesis which is tested for plausible rejection is called the Null Hypothesis…
Q: A random sample of n1 = 10 regions in New England gave the following violent crime rates (per…
A:
Q: Data on the gasoline tax per gallon (in cents) as of a certain date for the 50 U.S. states and the…
A: a) In a data set if an observation is greater than Q3 + 1.5(IQR) or less than Q1 – 1.5(IQR), then…
Q: A random sample of n1 = 10 regions in New England gave the following violent crime rates (per…
A: It is given that the violent crime rates in New England and Rocky Mountain. The claim is that the…
Q: A random sample of n1 = 10 regions in New England gave the following violent crime rates (per…
A: Let μ1 denote mean violent crime rate in New England and μ2 denote the mean violent crime rate in…
Q: A town has two competing internet service providers, A and B. Every year, 11% of people with…
A:
Q: The following table summarizes the outcome for 70 people who attended a picnic, some of whom ate…
A: From the given information, Yes No Total Salad-Yes 22 24 46 Salad-No 1 23 24 Total 23 47…
Q: In the following, define in words the population parameter p. Twenty students are randomly selected…
A: In the given situation, the population is majority of sorority and fraternity students. The…
Q: The results of a search to find the least expensive round-trip flights to Atlanta and Salt Lake City…
A: a) The Mean price for Atlanta and Salt Lake city is as follows: Number of observations = 14. Mean…
Q: According to the IRS, individuals filing federal income tax returns prior to March 31 received an…
A: The significance of the mean is calculated if the population standard deviation is unknown and the…
Q: In a survey of 250 employees of a company regarding their 401(K) investments, the following data…
A:
Q: Now assume that Master Yactually completed a repeated measures design in which he had the same two…
A: Solution
Q: In order to capitalize on the growth in ecommerce and the possibility to reduce operational costs,…
A: Given the data, gathered from 42 random persons about their preferences for shopping online and…
Q: In the course of her investigation, Sloan is also interested in whether customers would purchase a…
A: Probability is the chances of occurrence of an event and it can take values from 0 to 1. The…
Q: Based on a survey of 12,344 U.S. college students and 6,729 Canadian college students, Kuo, Adlaf,…
A: Introduction: A survey research design is a design in research, where the researcher conducts a…
Q: A random sample of n1 = 10 regions in New England gave the following violent crime rates (per…
A:
Q: Which of the following is an appropriate formulation for the hypotheses test? Enter the…
A: As this question contains multiple sub-parts, we are allowed to answer three sub-parts: The…
Q: A survey of randomly selected university students found that 91 of the 106 first-year students and…
A: (a) Using Excel formula “=NORM.S.INV(1-(0.02/2))” (or from standard normal distribution table), the…
Q: In the book Essentials of Marketing Research, William R. Dillon, Thomas J. Madden, and Neil A.…
A: Ans: Solution
Q: The HEALTH resources and services. reported that 6% of people who recieved Kidny transplants were…
A: Given Information: The proportion of the people who received kidney transplants under the age of 18…
Q: The annual inventory of Bargain Bonanza, Inc. shows the following information for jackets: Date Qty…
A: FIFO(First In, First Out) method is used for the asset valuation. The number of required units…
Q: An experiment was performed to attempt to answer the question of interest posed in Question 12. In…
A: Given Level of significance ɑ=0.05, df=min(n1-1,n2-1)
Q: The Ignorance Survey: United Kingdon Exercise 4.113 refers to a survey used to assess the ignorance…
A: Given information: Given that among a sample of 373 university degree holders, 45 responded with the…
Q: In the book Essentials of Marketing Research, William R. Dillon, Thomas J. Madden, and Neil A.…
A: Hypothesis test is the statistical analysis in which analyst test the assumptions regarding the…
Q: x1: New England Crime Rate 3.3 3.7 4.0 3.9 3.3 4.1 1.8 4.8 2.9 3.1 Another random sample of n2 =…
A: Given that, x1: New England Crime Rate 3.3 3.7 4.0 3.9 3.3 4.1 1.8 4.8 2.9…
Q: In a previous poll, 42% of adults with children under the age of 18 reported that their family ate…
A:
Q: Suppose a company surveyed the work prelerences and attitudes of 1,006 working adults spread over…
A:
Q: A random sample of n1 = 10 regions in New England gave the following violent crime rates (per…
A: Introduction: Assume that the crime rate in Region NE and Region RM are independent. Further, the…
Q: A random sample of n1 = 10 regions in New England gave the following violent crime rates (per…
A: given, n1=10, n2=12 where n1 is the violent crime rate in New England Crime rate x1 =…
Q: o eight hours of sle
A: Given as, 7 rules are : 1)no smoking, 2)regular exercise, 3)use alcohol moderately, 4)get seven to…
Q: A random sample of n1 = 10 regions in New England gave the following violent crime rates (per…
A: State the hypotheses.
Q: A random sample of n1 = 10 regions in New England gave the following violent crime rates (per…
A: Given Data and calculation is shown below
Q: It is determined that there are, on average, 20 patients registering or waiting to be registered, 5…
A: The "ordinary" number of an assortment of numbers made by mixing the assortment of numbers is called…
Q: A random sample of n1 = 10 regions in New England gave the following violent crime rates (per…
A: Assume that the crime rate in Region NE and Region RM are independent. Further, the population…
Q: b. If the Simpsons chose to move to nearby Shelbyville, where per pupil expenditure is higher,…
A:
Q: The results of a search to find the least expensive round-trip flights to Atlanta and Salt Lake City…
A: Given: Sample size n = 14 Formula Used: Mean X = ∑Xin Range = Maximum value - Minimum value…
Q: A random sample of n1 = 10 regions in New England gave the following violent crime rates (per…
A: Introduction: Denote μ1, μ2 as the true mean crime rates in New England and Rocky Mountain,…
Q: The following are the weekly losses of worker-hours due to accidents in 10 industrial plants before…
A: From the provided information, Sample size (n) = 10 Level of significance (α) = 0.05
Q: A random sample of n1 = 10 regions in New England gave the following violent crime rates (per…
A:
Q: A survey of enrollment at 35 community colleges across the United States yielded the following…
A: We have to calculate mean and standard deviation.
Q: the book Business Research Methods (5th ed.), Donald R. Cooper and C. William Emory discuss studying…
A: Given: The contingency table is shown below Smoker Yes No Row total Heavy 10 5 15 Moderate 7…
Q: 1. The quality control team of an auto-parts manufacturing company accounted that there are 7…
A: Given:Total models = 55000 per year7 defective model for every 1100 models
Q: - llansactional Records Access Clearinghouse at Syracuse University reported d cent of the returns…
A: Given Information: The data represents the odds of an Internal Revenue Service audit. It shows the…
Q: A random sample of n1 = 10 regions in New England gave the following violent crime rates (per…
A:
Q: A manufacturer of exercise equipment knows that 15% of their products are defective. They also know…
A: Define the events, A : The product is defective B : The customer actually use the equipment in the…
Q: According, to an article in USA Today, the median down payment on a $150,000 home for a first-time…
A: The hypothesis test is a statistical method in which one using the sample data try to check the…
Q: The Easy Credit Company reports the following table representing a breakdown of costumers according…
A: From the given information Given that a customer received a cash advance, Probability that the…
Step by step
Solved in 2 steps
- According to the Pew Research Center,on the propotion of the American population who use only a cellular telephone (landline) is 0.37. Jason conducts a survey of one hundred fifty 20 to 24 year olds who live on their own and finds that 73 do not have a landline to their home. Does this provide sufficient evidence to conclude that the proportion of 20 to 24 year olds who live on their own and don't have a landline is greater than 0.37? Use a=0.10 level of significance. A) Verify that nP0(1-P0)>10 and n< 0.05N (Assume the population sizes is N=40 million) B) State the appropiate null and alternative hypotheses. C) Indicate whether the hypothesis is left, right, or two- tailed.Suppose because of facility limitations, a large privately owned nursing home has been turning away large numbers of patients requesting admission. Because the nursing home receives some financial assistance from public sources, they are prohibited from making the decision concerning admission on the basis of whether payment is from Medicaid or private funds. As part of a compliance study, suppose that researchers collect the following data over a two year period. Of the 88 Medicaid patients applying for admission, 24 are admitted while 64 are not. Of the 110 privately funded patients applying for admission, 62 are admitted while 48 are not. Are admission status and funding independent? Admitted (A) Not Admitted Medicaid (M) 24 64 Privately Funded 62 48 Group of answer choices No, because P(M | A) is not equal to P(M No, because P(M | A) = P(M) Yes, because P(M | A) = P(M Yes, because P(M | A) is not equal to P(M)According to the IRS, individuals filing federal income tax returns prior to March 31 received an average refund of $1056 in 2018. Consider the population of “last-minute” filers who mail their tax return during the last five days of the income tax period (typically April 10 to April 15). A researcher suggests that a reason individuals wait until the last five days is that on average these individuals receive lower refunds than do early filers. For a sample of 400 individuals who filed a tax return between April 10 and 15, the sample mean refund was $910. Based on prior experience, a population standard deviation of σ = $1,600 may be assumed. Test the researcher's assertion using the critical value approach. Use α = 0.05 (Please include all the 7 steps in hypothesis testing) Steps in hypothesis testing p-value Approach Develop the null and alternative hypothesis Specify the level of significance, α Choose the test statistic (z or t) Calculate the test statistic Use the value of the…
- Do well-rounded people get fewer colds? A study on the Chronicle of Higher Education was conducted by scientist at Carnegie Mellon University, the University of Pittsburgh and the University of Virginia. They found that people who have only a few social outlets get more colds than those who are involved in a variety of social activities. Suppose that of the 276 healthy men and women tested, n1=96 had only a few social outlets and n2=105 were busy with six or more activities. When these people were exposed to a cold virus, the following results were observed: Construct a 99% confidence interval for the difference in the two population proportions.According to Nielsen Media Research, of all the U. S. Households that owned at least one television set, 83% had two or more sets. A local cable Company canvassing the town to promote a new cable service found that of the 300 randomly selected households visited, 240 had two or more television sets. At , is there sufficient evidence to conclude that the proportion is less than the one in the report?According to the National Institute on Alcohol Abuse and Alcoholism (NIAAA) and the National Institutes of Health (NIH), 41% of college students nationwide engage in "binge-drinking" behavior: having five or more drinks on one occasion during the past two weeks. A college president wonders if the proportion of students enrolled at her college who binge drink is actually lower than the national proportion. In a commissioned study, 344 students are selected randomly from a list of all students enrolled at the college. Of these, 132 admit to having engaged in binge drinking.The college president is more interested in testing her belief that the proportion of students at her college who engage in binge drinking is lower than the national proportion of 0.41. What is the P-value? (Round your answer to four decimal places.)P-value = ?
- The quality department at an electronics company has noted that, historically, 91% of the units of a specific product pass a test operation, 6% fail the test but are able to be repaired, and 3% fail the test and need to be scrapped. Due to recent process improvements, the quality department would like to test if the rates have changed. A recent sample of 500 parts revealed that 473 parts passed the test, 20 parts failed the test but were repairable, and 7 parts failed the test and were scrapped. (You may find it useful to reference the appropriate table: chi-square table or table)a. Choose the appropriate alternative hypothesis for the test.The University is considering changing the email system that they currently use. Since there are substantial learning costs associated with any new software, the University only wants to change to the new system if it is very confident that there is at least a 20% difference in the proportion of faculty and staff who say they like the new system. In a sample of 140 users of the current system, the University finds that 75 say they like the current system. In another sample of 85 experimental users of the “new” system, the University finds that 72 of them like the new system. When testing the hypothesis (using a 5% level of significance) that there is at least a 20% difference in the proportion of users who like the two systems, what is the null and alternative hypothesis?The University is considering changing the email system that they currently use. Since there are substantial learning costs associated with any new software, the University only wants to change to the new system if it is very confident that there is at least a 20% difference in the proportion of faculty and staff who say they like the new system. In a sample of 139 users of the current system, the University finds that 66 say they like the current system. In another sample of 92 experimental users of the “new” system, the University finds that 73 of them like the new system. When testing the hypothesis (using a 5% level of significance) that there is at least a 20% difference in the proportion of users who like the two systems, what is the test statistic? (please round your answer to 2 decimal places)
- AMS communicates with customers who subscribe to cable television services through a special secured email system that sends messages about service changes, new features, and billing information to in-home digital set-top boxes for later display. To enhance customer service, the operations department established the business objective of reducing the amount of time to fully update each subscriber’s set of messages. The department selected two candidate messaging systems and conducted an experiment in which 30 andomly chosen cable subscribers were assigned one of the two systems (15 assigned to each system). Update times were measured, and the results are organized in Table AMS10.1. Email Interface1 4.13 3.75 3.93 3.74 3.36 3.85 3.26 3.73 4.06 3.33 3.96 3.57 3.13 3.68 3.63 Email Interface 2 3.71 3.89 4.22 4.57 4.24 3.90 4.09 4.05 4.07 3.80 4.36 4.38 3.49 3.57 4.74 1. Analyze the data in Table AMS10.1 and do a statistical test with hypothesis. Kindly discuss the reason you selected a…A sociologist sampled 200 people who work in computer-related jobs, and found that 42 of them have changed jobs in the past six months. Can you conclude that more than 15% of computer-related workers have changed jobs in the past six months?4. The National Institute of Mental Health published an article stating that in any one-year period, approximately 9.5 percent of American adults suffer from depression or a depressive illness. Suppose that in a survey of 100 people in a certain town, seven of them suffered from depression or a depressive illness. Conduct a hypothesis test to determine if the true proportion of people in that town suffering from depression or a depressive illness is lower than the percent in the general adult American population.