In the graph below, assume that the original demand and supply curves are given by D₁ and S, respectively. Question 1 Tasks: 1. Locate the original equilibrium point, graphically identifying both the original equilibrium price and quantity. Clearly label the equilibrium price as P, and equilibrium quantity as Q₁. 2. Now assume that supply decreases. How is this represented on the graph? Clearly show and label the changes. 3. Locate the new equilibrium point. What happens to the equilibrium price when supply decreases? What happens to the equilibrium quantity? Clearly label the new equilibrium price as P₂ and the new equilibrium quantity as Q₂. 4. Finally, discuss the idea of price as a rationing device in the context of this example. (Suggested response length: one paragraph or 3 to 4 sentences). S₁ IX Price Quantity
In the graph below, assume that the original demand and supply curves are given by D₁ and S, respectively. Question 1 Tasks: 1. Locate the original equilibrium point, graphically identifying both the original equilibrium price and quantity. Clearly label the equilibrium price as P, and equilibrium quantity as Q₁. 2. Now assume that supply decreases. How is this represented on the graph? Clearly show and label the changes. 3. Locate the new equilibrium point. What happens to the equilibrium price when supply decreases? What happens to the equilibrium quantity? Clearly label the new equilibrium price as P₂ and the new equilibrium quantity as Q₂. 4. Finally, discuss the idea of price as a rationing device in the context of this example. (Suggested response length: one paragraph or 3 to 4 sentences). S₁ IX Price Quantity

Chapter4: Demand, Supply, And Market Equilibrium
Section: Chapter Questions
Problem 25P

Related questions
Question
part 3 4
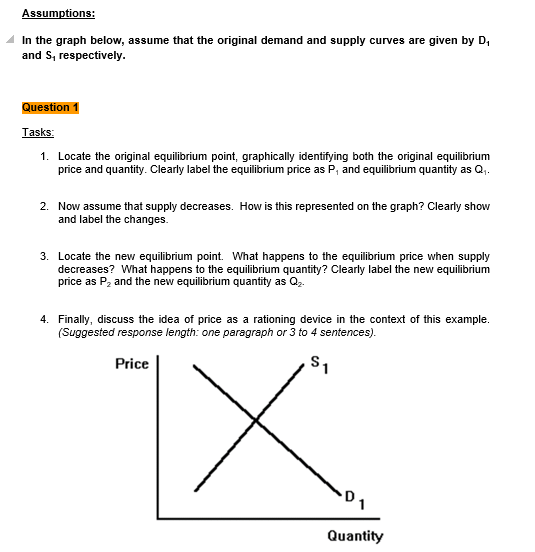
Transcribed Image Text:Assumptions:
In the graph below, assume that the original demand and supply curves are given by D₁
and S, respectively.
Question 1
Tasks:
1. Locate the original equilibrium point, graphically identifying both the original equilibrium
price and quantity. Clearly label the equilibrium price as P, and equilibrium quantity as Q₁.
2. Now assume that supply decreases. How is this represented on the graph? Clearly show
and label the changes.
3. Locate the new equilibrium point. What happens to the equilibrium price when supply
decreases? What happens to the equilibrium quantity? Clearly label the new equilibrium
price as P₂ and the new equilibrium quantity as Q₂.
4. Finally, discuss the idea of price as a rationing device in the context of this example.
(Suggested response length: one paragraph or 3 to 4 sentences).
S₁
IX
Price
Quantity
Expert Solution
This question has been solved!
Explore an expertly crafted, step-by-step solution for a thorough understanding of key concepts.

This is a popular solution!

Trending now
This is a popular solution!

Step by step
Solved in 5 steps with 3 images

Knowledge Booster


Learn more about
Need a deep-dive on the concept behind this application? Look no further. Learn more about this topic, economics and related others by exploring similar questions and additional content below.Recommended textbooks for you
Exploring Economics
Economics
ISBN:
9781544336329
Author:
Robert L. Sexton
Publisher:
SAGE Publications, Inc


Exploring Economics
Economics
ISBN:
9781544336329
Author:
Robert L. Sexton
Publisher:
SAGE Publications, Inc


