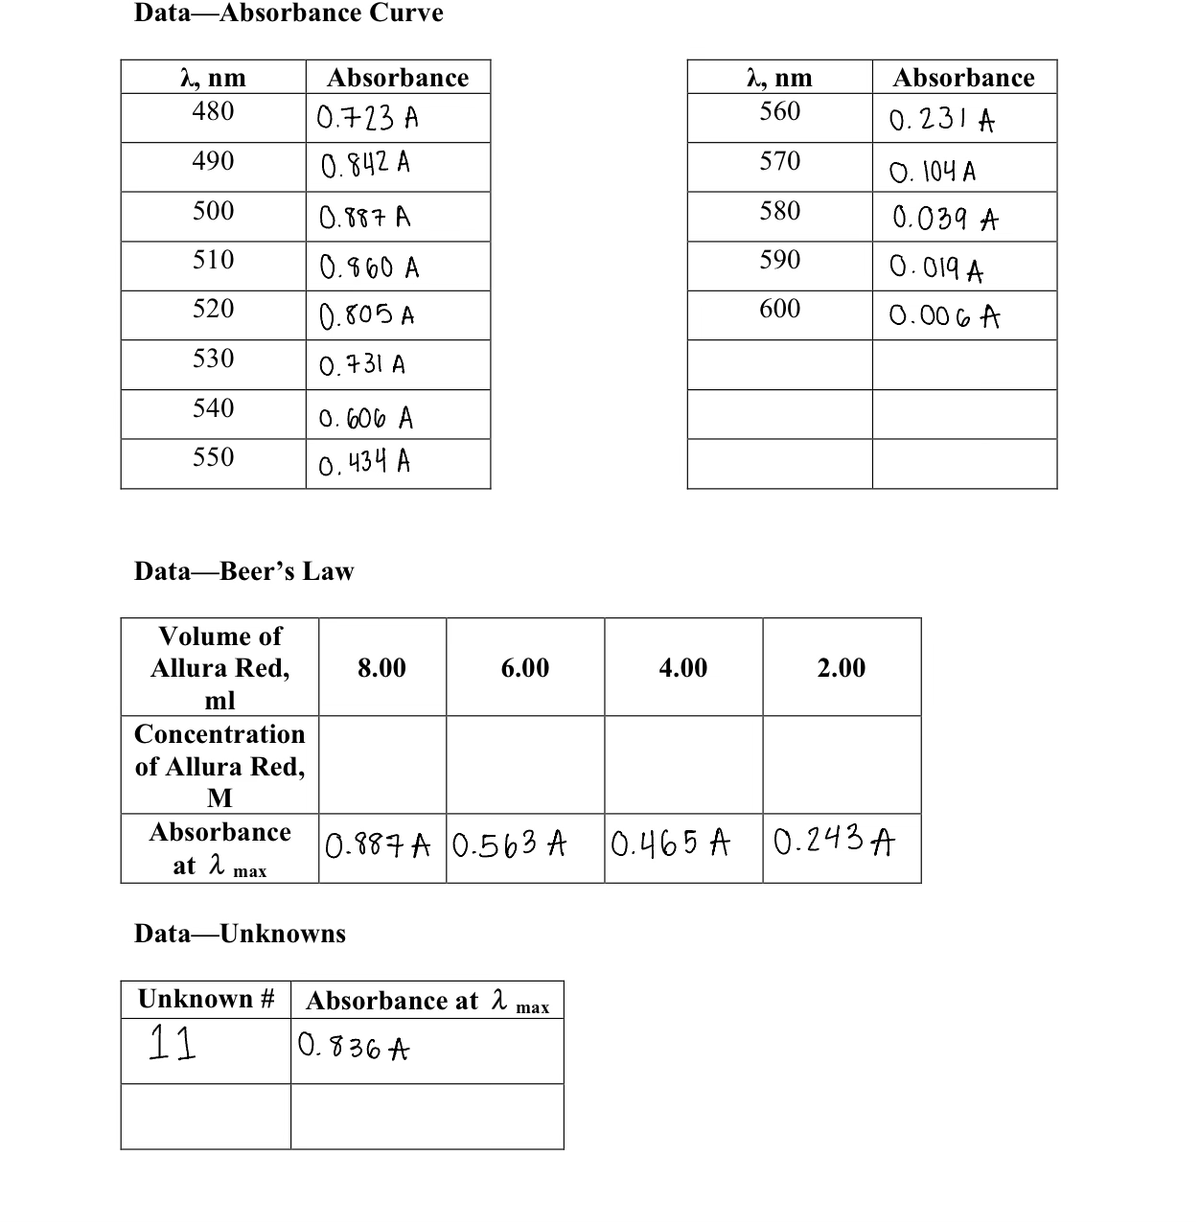
in the images attach can you please calculate the Concentration of Allura Red M and can you also please please Create graphs with Excel (or a similar program). Plot absorbance (v-axis) vs. A (×- axis) for the absorbance curve determined in part 2. Connect the points with a smooth curve. Plot absorbance (y-axis) vs. concentration (x-axis) for the Beer's Law data from part 3. Draw a best-fit line or use a program such as Excel and do a least-squares fit to determine the best-fit line through the points. lastly can you please show a sample the concentration of the solutions made by dilution. Also use the slope of the best-fit line from your absorbance vs. concentration plot to calculate the concentration of Allura Red in each unknown. Also please dont forget to do the results box in the image attach please please answer super super fast i really need it its very urgent and important please answer everything i need it before the end of today before 11:59pm I would really appreciate it if you would answer fast


in the images attach can you please calculate the Concentration of Allura Red M and can you also please please Create graphs with Excel (or a similar program). Plot absorbance (v-axis) vs. A (×- axis) for the absorbance curve determined in part 2. Connect the points with a smooth curve. Plot absorbance (y-axis) vs. concentration (x-axis) for the Beer's Law data from part 3. Draw a best-fit line or use a program such as Excel and do a least-squares fit to determine the best-fit line through the points.
lastly can you please show a sample the concentration of the solutions made by dilution. Also use the slope of the best-fit line from your absorbance vs. concentration plot to calculate the concentration of Allura Red in each unknown.
Also please dont forget to do the results box in the image attach
please please answer super super fast i really need it its very urgent and important please answer everything i need it before the end of today before 11:59pm I would really appreciate it if you would answer fast
![GRAPHS
Creating graphs with Excel (or a similar program) is preferred. Plot absorbance (y-axis) vs. λ (x-
axis) for the absorbance curve determined in part 2. Connect the points with a smooth curve.
Plot absorbance (y-axis) vs. concentration (x-axis) for the Beer's Law data from part 3. Draw a
best-fit line or use a program such as Excel and do a least-squares fit to determine the best-fit
line through the points. Attach your graphs to the yellow copies of your report from your
notebook.
CALCULATIONS
Show a sample calculation of the concentration of the solutions made by dilution. Also use the
slope of the best-fit line from your absorbance vs. concentration plot to calculate the
concentration of Allura Red in each unknown.
RESULTS
Unknown #
[Allura Red], M](/v2/_next/image?url=https%3A%2F%2Fcontent.bartleby.com%2Fqna-images%2Fquestion%2Fa833a647-b9ad-4697-b42a-39aaf6365497%2Fa312d8a4-3775-427c-be51-1661f2dfe78f%2Fv3qktfj_processed.png&w=3840&q=75)

Step by step
Solved in 5 steps with 2 images


