In the "Inflation and Interest Rate" experiment (see an overview of the results below), several lenders made negative "surplus" (= earnings). What is the likeliest explanation for the lenders losing "money" in this experimental market? Outcomes by Groups (Expected) Inflation Rate = 5% Group Equilibrium Interest Rate (Nominal) Inflation Rate Real Interest Rate #Transactions Lender Surplus Borrower Surplus 972 N/A 4.50 5.00 11.50 2050 Average 1.96 1.50 0.00 21.00 -1.03 19.43 Group 1 7.00 5.00 1.90 2.00 3.19 Group 2 7.50 10.00 -2.27 4.00 -3.32 16.19 27.18 Group 3 900 1000 -0.01 4.00 2.50 12 18 Group 4 5.00 1000 -364 5.00 -9.77 34.59 Group 5 8.00 0.00 8.00 2.00 0.90 15.00 Group 6 10.25 10.00 0.23 4.00 6.68 11.45 Lenders made decisions based on the nominal interest rate, not the expected real interest rate, which was higher than the nominal interest rate. Lenders made decisions based on the expected real interest rate, not the nominal interest rate, which was lower than the real interest rate. Lenders made decisions based on the nominal interest rate, not the expected real interest rate, which was lower than the nominal interest rate. Lenders made decisions based on the expected real interest rate, not the nominal interest rate, which was higher than the real interest rate.
In the "Inflation and Interest Rate" experiment (see an overview of the results below), several lenders made negative "surplus" (= earnings). What is the likeliest explanation for the lenders losing "money" in this experimental market? Outcomes by Groups (Expected) Inflation Rate = 5% Group Equilibrium Interest Rate (Nominal) Inflation Rate Real Interest Rate #Transactions Lender Surplus Borrower Surplus 972 N/A 4.50 5.00 11.50 2050 Average 1.96 1.50 0.00 21.00 -1.03 19.43 Group 1 7.00 5.00 1.90 2.00 3.19 Group 2 7.50 10.00 -2.27 4.00 -3.32 16.19 27.18 Group 3 900 1000 -0.01 4.00 2.50 12 18 Group 4 5.00 1000 -364 5.00 -9.77 34.59 Group 5 8.00 0.00 8.00 2.00 0.90 15.00 Group 6 10.25 10.00 0.23 4.00 6.68 11.45 Lenders made decisions based on the nominal interest rate, not the expected real interest rate, which was higher than the nominal interest rate. Lenders made decisions based on the expected real interest rate, not the nominal interest rate, which was lower than the real interest rate. Lenders made decisions based on the nominal interest rate, not the expected real interest rate, which was lower than the nominal interest rate. Lenders made decisions based on the expected real interest rate, not the nominal interest rate, which was higher than the real interest rate.

Managerial Economics: A Problem Solving Approach
5th Edition
ISBN:9781337106665
Author:Luke M. Froeb, Brian T. McCann, Michael R. Ward, Mike Shor
Publisher:Luke M. Froeb, Brian T. McCann, Michael R. Ward, Mike Shor
Chapter2: The One Lesson Of Business
Section: Chapter Questions
Problem 2.6IP

Related questions
Question
Only MCQ Question solve pls .....I will give upvote....
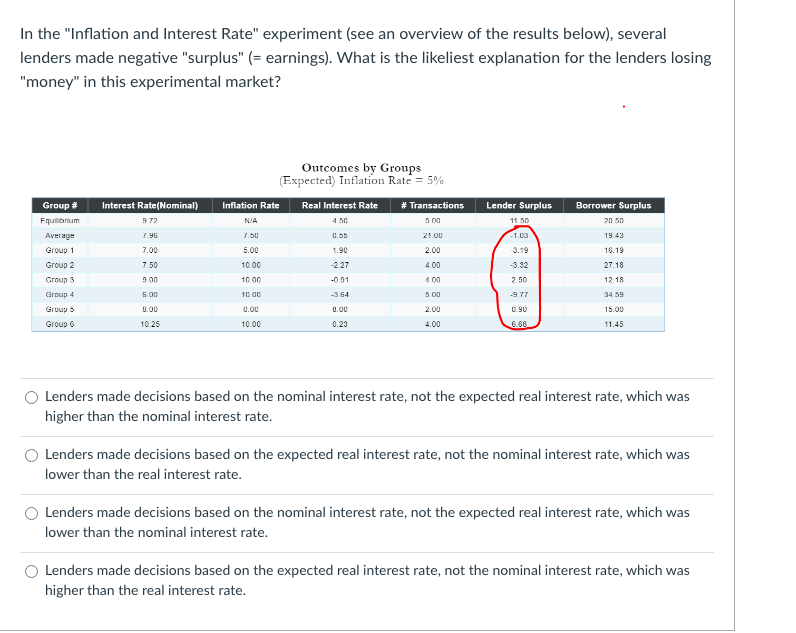
Transcribed Image Text:In the "Inflation and Interest Rate" experiment (see an overview of the results below), several
lenders made negative "surplus" (= earnings). What is the likeliest explanation for the lenders losing
"money" in this experimental market?
Outcomes by Groups
(Expected) Inflation Rate = 5%
Group #
Interest Rate(Nominal)
Inflation Rate
Real Interest Rate # Transactions
Lender Surplus
Borrower Surplus
Equilibrium
972
N/A
4.50
5.00
11.50
20.50
Average
7.96
7.50
0.5b
21.00
-1.03
19.43
Group 1
7.00
5.00
1.90
2.00
3.19
16.19
Group 2
7.50
10.00
-2.27
4.00
-3.32
27.18
Group 3
9.00
10.00
-0.91
4.00
2.50
12.18
Group 4
5.00
10.00
-3.64
5.00
-9.77
34.59
Group 5
8.00
0.00
8.00
2.00
0.90
15.00
Group 6
10.25
10.00
0.23
4.00
6.68
11.45
Lenders made decisions based on the nominal interest rate, not the expected real interest rate, which was
higher than the nominal interest rate.
Lenders made decisions based on the expected real interest rate, not the nominal interest rate, which was
lower than the real interest rate.
Lenders made decisions based on the nominal interest rate, not the expected real interest rate, which was
lower than the nominal interest rate.
Lenders made decisions based on the expected real interest rate, not the nominal interest rate, which was
higher than the real interest rate.
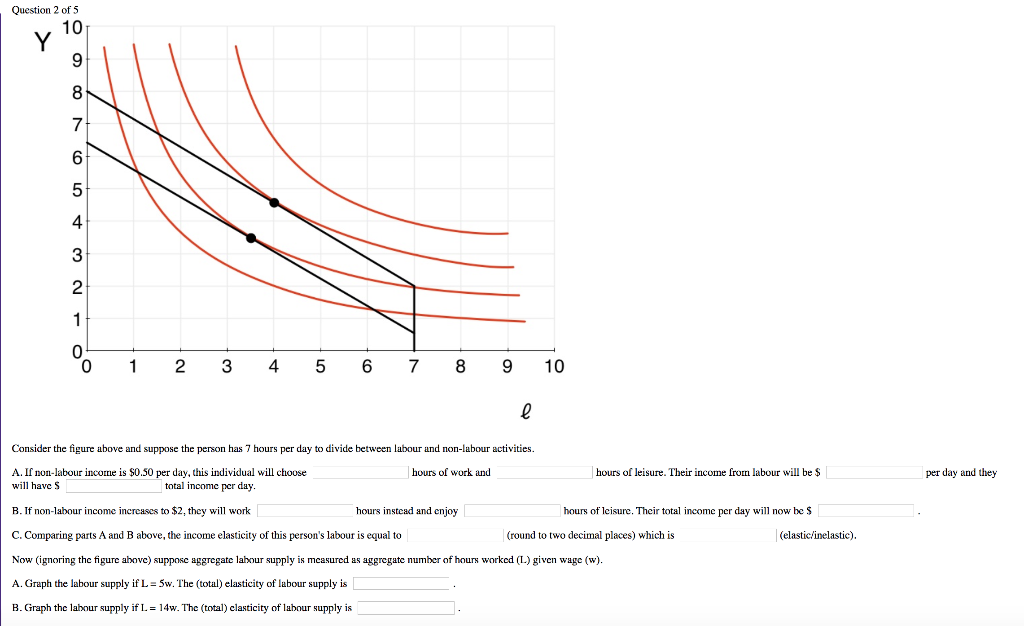
Transcribed Image Text:Question 2 of 5
Y
10
9
8
7
6
5
4
3
2
1
0
0
1 2
3
4 5 6 7 8 9
10
l
total income per day.
Consider the figure above and suppose the person has 7 hours per day to divide between labour and non-labour activities.
A. If non-labour income is $0.50 per day, this individual will choose
hours of work and
will have $
hours instead and enjoy
hours of leisure. Their income from labour will be $
B. If non-labour income increases to $2, they will work
C. Comparing parts A and B above, the income elasticity of this person's labour is equal to
hours of leisure. Their total income per day will now be $
(round to two decimal places) which is
(elastic/inelastic).
Now (ignoring the figure above) suppose aggregate labour supply is measured as aggregate number of hours worked (L) given wage (w).
A. Graph the labour supply if L=5w. The (total) elasticity of labour supply is
B. Graph the labour supply if L. = 14w. The (total) clasticity of labour supply is
per day and they
Expert Solution
This question has been solved!
Explore an expertly crafted, step-by-step solution for a thorough understanding of key concepts.

Step by step
Solved in 4 steps

Knowledge Booster


Learn more about
Need a deep-dive on the concept behind this application? Look no further. Learn more about this topic, economics and related others by exploring similar questions and additional content below.Recommended textbooks for you
Managerial Economics: A Problem Solving Approach
Economics
ISBN:
9781337106665
Author:
Luke M. Froeb, Brian T. McCann, Michael R. Ward, Mike Shor
Publisher:
Cengage Learning


Managerial Economics: A Problem Solving Approach
Economics
ISBN:
9781337106665
Author:
Luke M. Froeb, Brian T. McCann, Michael R. Ward, Mike Shor
Publisher:
Cengage Learning


Principles of Economics 2e
Economics
ISBN:
9781947172364
Author:
Steven A. Greenlaw; David Shapiro
Publisher:
OpenStax