In the Izmir University of Economics, a professor claims that exam scores for non-accounting majors are more variable than for accounting majors. Random samples 30 non-accounting majors and 30 accounting majors are taken from a final exam held on 2019. Test at the 5% level the null hypothesis that the two population variances are equal against the alternative that the true variance is higher for the non-accounting majors. Assume the populations are normally distributed. 2 = 1584 272 2 = 400.495 Non-Accounting ny = 30 Accounting ny = 30 OC. Họ: 0 = O D. Ho o =0 The test statistic is F =] (Round to three decimal places as needed) The critical value is O (Round to two decimal places as needed.) the critical value, the null hypothesis. There is evidence to support the professor's claim Since the test statistic is at the 5% level.
In the Izmir University of Economics, a professor claims that exam scores for non-accounting majors are more variable than for accounting majors. Random samples 30 non-accounting majors and 30 accounting majors are taken from a final exam held on 2019. Test at the 5% level the null hypothesis that the two population variances are equal against the alternative that the true variance is higher for the non-accounting majors. Assume the populations are normally distributed. 2 = 1584 272 2 = 400.495 Non-Accounting ny = 30 Accounting ny = 30 OC. Họ: 0 = O D. Ho o =0 The test statistic is F =] (Round to three decimal places as needed) The critical value is O (Round to two decimal places as needed.) the critical value, the null hypothesis. There is evidence to support the professor's claim Since the test statistic is at the 5% level.

A First Course in Probability (10th Edition)
10th Edition
ISBN:9780134753119
Author:Sheldon Ross
Publisher:Sheldon Ross
Chapter1: Combinatorial Analysis
Section: Chapter Questions
Problem 1.1P: a. How many different 7-place license plates are possible if the first 2 places are for letters and...

Related questions

Question
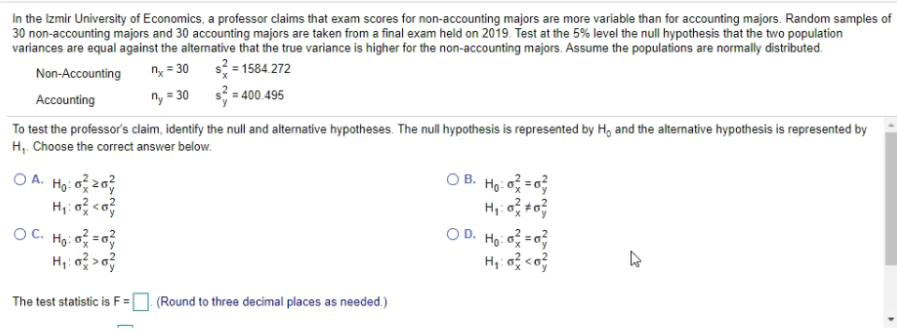
Transcribed Image Text:In the Izmir University of Economics, a professor claims that exam scores for non-accounting majors are more variable than for accounting majors. Random samples of
30 non-accounting majors and 30 accounting majors are taken from a final exam held on 2019. Test at the 5% level the null hypothesis that the two population
variances are equal against the alternative that the true variance is higher for the non-accounting majors. Assume the populations are normally distributed.
s = 1584.272
ny = 30 s = 400.495
Non-Accounting
n = 30
Accounting
To test the professor's claim, identify the null and alternative hypotheses. The null hypothesis is represented by H, and the alternative hypothesis is represented by
H,. Choose the correct answer below.
O A. Ho: o 2
O B. Ho: o =
OD. Ho: o =0
H,: o <o
OC. Họ: o = 0
The test statistic is F =
(Round to three decimal places as needed.)
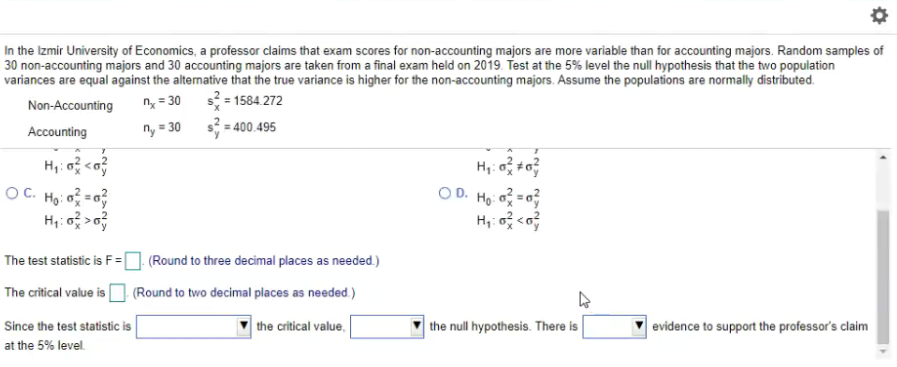
Transcribed Image Text:In the Izmir University of Economics, a professor claims that exam scores for non-accounting majors are more variable than for accounting majors. Random samples of
30 non-accounting majors and 30 accounting majors are taken from a final exam held on 2019. Test at the 5% level the null hypothesis that the two population
variances are equal against the alternative that the true variance is higher for the non-accounting majors. Assume the populations are normally distributed.
s = 1584. 272
s3 = 400.495
Non-Accounting
n = 30
Accounting
ny = 30
OC. Ho: =
O D. Ho o =0
The test statistic is F=
(Round to three decimal places as needed.)
The critical value i [
(Round to two decimal places as needed.)
Since the test statistic is
the critical value,
the null hypothesis. There is
evidence to support the professor's claim
at the 5% level.
Expert Solution
This question has been solved!
Explore an expertly crafted, step-by-step solution for a thorough understanding of key concepts.

Step by step
Solved in 4 steps

Knowledge Booster


Learn more about
Need a deep-dive on the concept behind this application? Look no further. Learn more about this topic, probability and related others by exploring similar questions and additional content below.Recommended textbooks for you
A First Course in Probability (10th Edition)
Probability
ISBN:
9780134753119
Author:
Sheldon Ross
Publisher:
PEARSON

A First Course in Probability (10th Edition)
Probability
ISBN:
9780134753119
Author:
Sheldon Ross
Publisher:
PEARSON