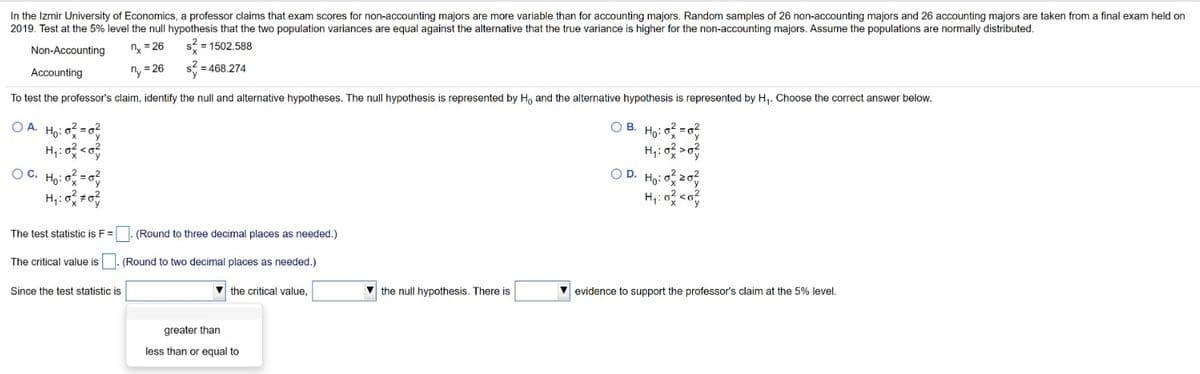
In the Izmir University of Economics, a professor claims that exam scores for non-accounting majors are more variable than for accounting majors. Random samples of 26 non-accounting majors and 26 accounting majors are taken from a final exam held o 2019. Test at the 5% level the null hypothesis that the two population variances are equal against the alternative that the true variance is higher for the non-accounting majors. Assume the populations are normally distributed. n - 26 s- 1502.588 Non-Accounting Accounting ny - 26 s = 468.274 To test the professor's claim, identify the null and alternative hypotheses. The null hypothesis is represented by H, and the alternative hypothesis is represented by H,. Choose the correct answer below. OA Ho: o =0 OB. Ho: o - OC. Ho: o = OD. Ho: o20 The test statistic is F= . (Round to three decimal places as needed.) The critical value is (Round to two decimal places as needed.) Since the test statistic is V the critical value, v the null hypothesis. There is v evidence support the professor's claim at the 5% level. greater than less than or equal to


Continuous Probability Distributions
Probability distributions are of two types, which are continuous probability distributions and discrete probability distributions. A continuous probability distribution contains an infinite number of values. For example, if time is infinite: you could count from 0 to a trillion seconds, billion seconds, so on indefinitely. A discrete probability distribution consists of only a countable set of possible values.
Normal Distribution
Suppose we had to design a bathroom weighing scale, how would we decide what should be the range of the weighing machine? Would we take the highest recorded human weight in history and use that as the upper limit for our weighing scale? This may not be a great idea as the sensitivity of the scale would get reduced if the range is too large. At the same time, if we keep the upper limit too low, it may not be usable for a large percentage of the population!

Step by step
Solved in 2 steps


