In the Petroco Service Station problem, for the exponentially smoothed forecast with an a value of .50, compute the mean absolute deviation (MAD) via Excel and/or POM- QM. It is (type number only, two decimals) 248.13
In the Petroco Service Station problem, for the exponentially smoothed forecast with an a value of .50, compute the mean absolute deviation (MAD) via Excel and/or POM- QM. It is (type number only, two decimals) 248.13

Practical Management Science
6th Edition
ISBN:9781337406659
Author:WINSTON, Wayne L.
Publisher:WINSTON, Wayne L.
Chapter13: Regression And Forecasting Models
Section13.6: Moving Averages Models
Problem 22P: The file P13_22.xlsx contains total monthly U.S. retail sales data. While holding out the final six...

Related questions
Question
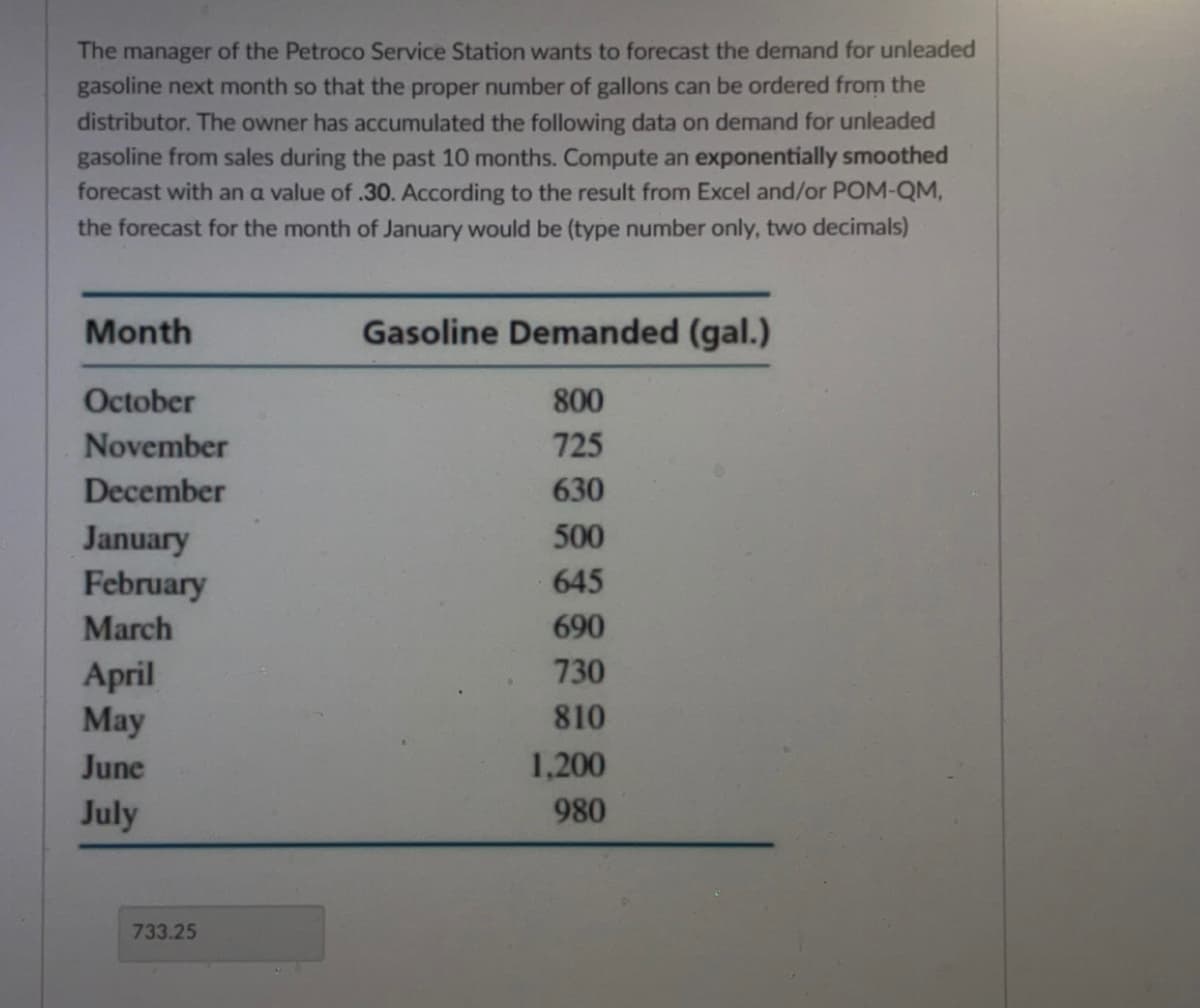
Transcribed Image Text:The manager of the Petroco Service Station wants to forecast the demand for unleaded
gasoline next month so that the proper number of gallons can be ordered from the
distributor. The owner has accumulated the following data on demand for unleaded
gasoline from sales during the past 10 months. Compute an exponentially smoothed
forecast with an a value of .30. According to the result from Excel and/or POM-QM,
the forecast for the month of January would be (type number only, two decimals)
Month
October
November
December
January
February
March
April
May
June
July
733.25
Gasoline Demanded (gal.)
800
725
630
500
645
690
730
810
1,200
980
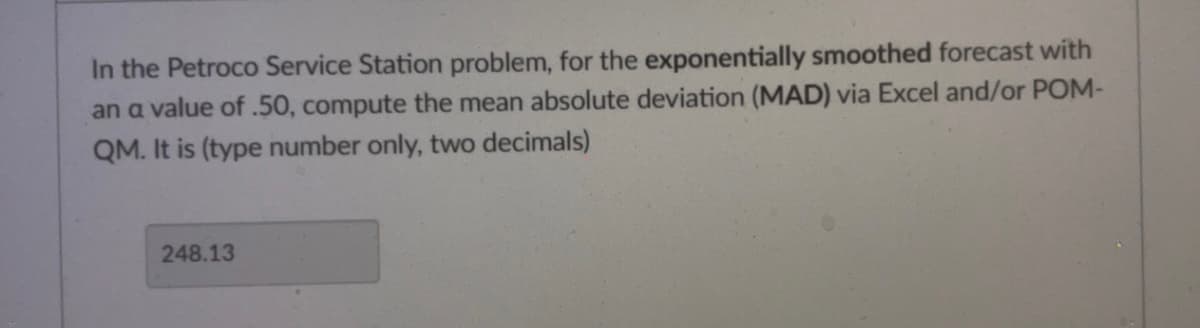
Transcribed Image Text:In the Petroco Service Station problem, for the exponentially smoothed forecast with
an a value of .50, compute the mean absolute deviation (MAD) via Excel and/or POM-
QM. It is (type number only, two decimals)
248.13
Expert Solution
This question has been solved!
Explore an expertly crafted, step-by-step solution for a thorough understanding of key concepts.

This is a popular solution!

Trending now
This is a popular solution!

Step by step
Solved in 4 steps with 4 images

Recommended textbooks for you
Practical Management Science
Operations Management
ISBN:
9781337406659
Author:
WINSTON, Wayne L.
Publisher:
Cengage,

Contemporary Marketing
Marketing
ISBN:
9780357033777
Author:
Louis E. Boone, David L. Kurtz
Publisher:
Cengage Learning

Marketing
Marketing
ISBN:
9780357033791
Author:
Pride, William M
Publisher:
South Western Educational Publishing
Practical Management Science
Operations Management
ISBN:
9781337406659
Author:
WINSTON, Wayne L.
Publisher:
Cengage,
Contemporary Marketing
Marketing
ISBN:
9780357033777
Author:
Louis E. Boone, David L. Kurtz
Publisher:
Cengage Learning
Marketing
Marketing
ISBN:
9780357033791
Author:
Pride, William M
Publisher:
South Western Educational Publishing