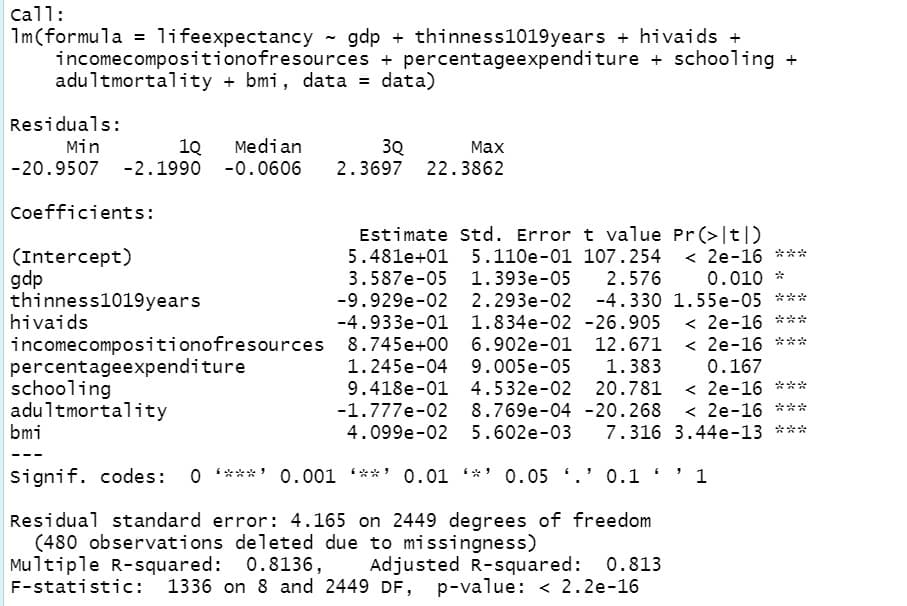
In the picture, there is a summary of regression analysis. Please interpret the P values for each coefficient and discuss the characteristics of your residuals.

Linear Algebra: A Modern Introduction
4th Edition
ISBN:9781285463247
Author:David Poole
Publisher:David Poole
Chapter4: Eigenvalues And Eigenvectors
Section4.6: Applications And The Perron-frobenius Theorem
Problem 25EQ
icon
Related questions
icon
Concept explainers
Question
100%

In the picture, there is a summary of regression analysis. Please interpret the P values for each coefficient and discuss the characteristics of your residuals.


call:
1m(formula = lifeexpectancy - gdp + thinness1019years + hivaids +
incomecompositionofresources + percentageexpenditure + schooling +
adultmortality + bmi, data = data)
Residuals:
Median
1Q
-20.9507 -2.1990 -0.0606
Min
3Q
2.3697
22.3862
Max
Coefficients:
Estimate Std. Error t value Pr(>|t|)
5.481e+01 5.110e-01 107.254 < 2e-16 ***
(Intercept)
gdp
thinness1019years
hivaids
0.010 *
-9.929e-02 2.293e-02 -4.330 1.55e-05 ***
< 2e-16 ***
3.587e-05 1.393e-05
2.576
-4.933e-01 1.834e-02 -26.905
incomecompositionofresources 8.745e+00 6.902e-01 12.671 < 2e-16 ***
percentageexpenditure
schooling
adultmortality
bmi
1.245e-04 9.005e-05
1.383
0.167
< 2e-16 ***
< 2e-16 ***
7.316 3.44e-13 ***
9.418e-01 4.532e-02 20.781
-1.777e-02 8.769e-04 -20.268
4.099e-02 5.602e-03
Signif. codes: 0 ****
0.001 **' 0.01 *' 0.05 .' 0.1
1
Residual standard error: 4.165 on 2449 degrees of freedom
(480 observations deleted due to missingness)
Multiple R-squared: 0.8136,
F-statistic:
Adjusted R-squared: 0.813
1336 on 8 and 2449 DF, p-value: < 2.2e-16
Transcribed Image Text:call: 1m(formula = lifeexpectancy - gdp + thinness1019years + hivaids + incomecompositionofresources + percentageexpenditure + schooling + adultmortality + bmi, data = data) Residuals: Median 1Q -20.9507 -2.1990 -0.0606 Min 3Q 2.3697 22.3862 Max Coefficients: Estimate Std. Error t value Pr(>|t|) 5.481e+01 5.110e-01 107.254 < 2e-16 *** (Intercept) gdp thinness1019years hivaids 0.010 * -9.929e-02 2.293e-02 -4.330 1.55e-05 *** < 2e-16 *** 3.587e-05 1.393e-05 2.576 -4.933e-01 1.834e-02 -26.905 incomecompositionofresources 8.745e+00 6.902e-01 12.671 < 2e-16 *** percentageexpenditure schooling adultmortality bmi 1.245e-04 9.005e-05 1.383 0.167 < 2e-16 *** < 2e-16 *** 7.316 3.44e-13 *** 9.418e-01 4.532e-02 20.781 -1.777e-02 8.769e-04 -20.268 4.099e-02 5.602e-03 Signif. codes: 0 **** 0.001 **' 0.01 *' 0.05 .' 0.1 1 Residual standard error: 4.165 on 2449 degrees of freedom (480 observations deleted due to missingness) Multiple R-squared: 0.8136, F-statistic: Adjusted R-squared: 0.813 1336 on 8 and 2449 DF, p-value: < 2.2e-16
Expert Solution
steps

Step by step

Solved in 3 steps

Blurred answer
Knowledge Booster
Correlation, Regression, and Association
Learn more about
Need a deep-dive on the concept behind this application? Look no further. Learn more about this topic, statistics and related others by exploring similar questions and additional content below.
Similar questions
  • SEE MORE QUESTIONS
Recommended textbooks for you
Linear Algebra: A Modern Introduction
Algebra
ISBN:
9781285463247
Author:
David Poole
Publisher:
Cengage Learning
Algebra & Trigonometry with Analytic Geometry
Algebra
ISBN:
9781133382119
Author:
Swokowski
Publisher:
Cengage
Glencoe Algebra 1, Student Edition, 9780079039897…
Algebra
ISBN:
9780079039897
Author:
Carter
Publisher:
McGraw Hill