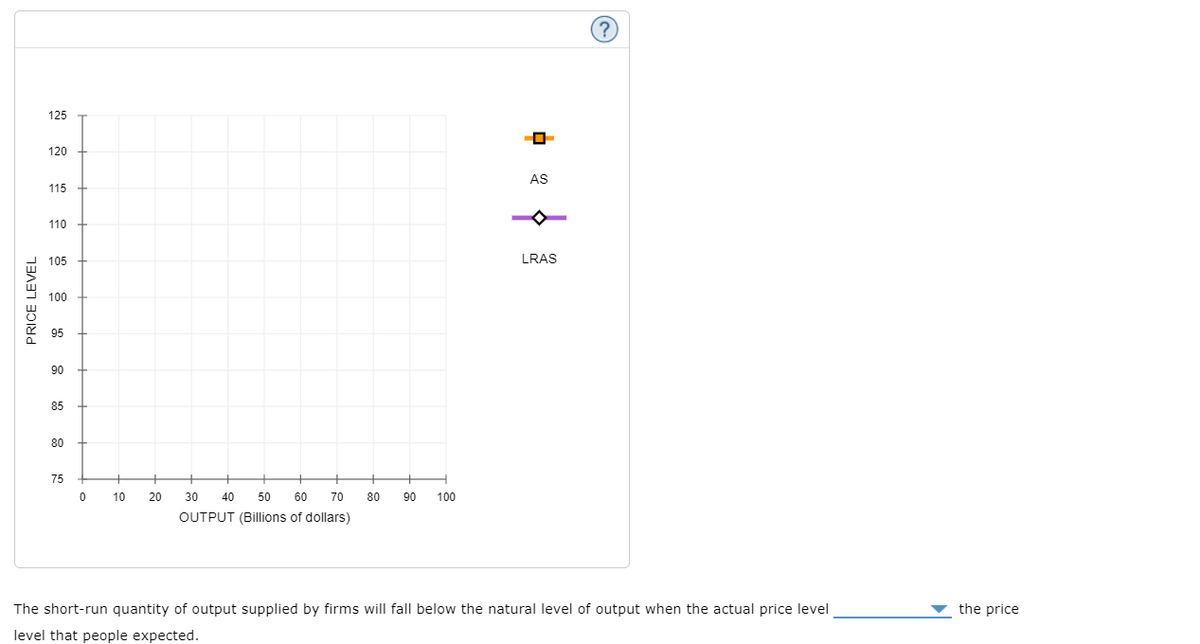
In the short run, the quantity of output that firms supply can deviate from the natural level of output if the actual price level in the economy deviates from the expected price level. Several theories explain how this might happen. For example, the misperceptions theory asserts that changes in the price level can temporarily mislead firms about what is happening to their output prices. Consider a soybean farmer who expects a price level of 100 in the coming year. If the actual price level turns out to be 90, soybean prices will and if the farmer mistakenly assumes that the price of soybeans declined relative to other prices of goods and services, she will respond by v the quantity of soybeans supplied. If other producers in this economy mistake changes in the price level for changes in their relative prices, the unexpected decrease in the price level causes the quantity of output supplied to the natural level of output in the short run. Suppose the economy's short-run aggregate supply (AS) curve is given by the following equation: Quantity of Output Supplied = Natural Level of Output + a x (Price Level Actual Price LevelEzpected) The Greek letter a represents a number that determines how much output responds to unexpected changes in the price level. In this case, assume that a = $2 billion. That is, when the actual price level exceeds the expected price level by 1, the quantity of output supplied will exceed the natural level of output by $2 billion. Suppose the natural level of output is $50 billion of real GDP and that people expect a price level of 100. On the following graph, use the purple line (diamond symbol) to plot this economy's long-run aggregate supply (LRAS) curve. Then use the orange line segments (square symbol) to plot the economy's short-run aggregate supply (AS) curve at each of the following price levels: 90, 95, 100, 105, and 110.
In the short run, the quantity of output that firms supply can deviate from the natural level of output if the actual price level in the economy deviates from the expected price level. Several theories explain how this might happen. For example, the misperceptions theory asserts that changes in the price level can temporarily mislead firms about what is happening to their output prices. Consider a soybean farmer who expects a price level of 100 in the coming year. If the actual price level turns out to be 90, soybean prices will and if the farmer mistakenly assumes that the price of soybeans declined relative to other prices of goods and services, she will respond by v the quantity of soybeans supplied. If other producers in this economy mistake changes in the price level for changes in their relative prices, the unexpected decrease in the price level causes the quantity of output supplied to the natural level of output in the short run. Suppose the economy's short-run aggregate supply (AS) curve is given by the following equation: Quantity of Output Supplied = Natural Level of Output + a x (Price Level Actual Price LevelEzpected) The Greek letter a represents a number that determines how much output responds to unexpected changes in the price level. In this case, assume that a = $2 billion. That is, when the actual price level exceeds the expected price level by 1, the quantity of output supplied will exceed the natural level of output by $2 billion. Suppose the natural level of output is $50 billion of real GDP and that people expect a price level of 100. On the following graph, use the purple line (diamond symbol) to plot this economy's long-run aggregate supply (LRAS) curve. Then use the orange line segments (square symbol) to plot the economy's short-run aggregate supply (AS) curve at each of the following price levels: 90, 95, 100, 105, and 110.

Brief Principles of Macroeconomics (MindTap Course List)
8th Edition
ISBN:9781337091985
Author:N. Gregory Mankiw
Publisher:N. Gregory Mankiw
Chapter15: Aggregate Demand And Aggregate Supply
Section: Chapter Questions
Problem 10PA

Related questions
Question
100%
Please give a typed detailed answer to the question below. Make sure the answer is correct. Please make sure the graph is visible and the points are clearly labeled.
Options For Fill In The Blanks Left To Right Top To Bottom:
fall or remain the same or rise
reducing or increasing
rises above or fall below
rise above or fall below
Transcribed Image Text:6. Why the aggregate supply curve slopes upward in the short run
In the short run, the quantity of output that firms supply can deviate from the natural level of output if the actual price level in the economy deviates
from the expected price level. Several theories explain how this might happen.
For example, the misperceptions theory asserts that changes in the price level can temporarily mislead firms about what is happening to their
output prices. Consider a soybean farmer who expects a price level of 100 in the coming year. If the actual price level turns out to be 90, soybean
prices will
, and if the farmer mistakenly assumes that the price of soybeans declined relative to other prices of goods and
services, she will respond by
▼ the quantity of soybeans supplied. If other producers in this economy mistake changes in the price level
for changes in their relative prices, the unexpected decrease in the price level causes the quantity of output supplied to
the natural
level of output in the short run.
Suppose the economy's short-run aggregate supply (AS) curve is given by the following equation:
Quantity of Output Supplied
Natural Level of Output + a × (Price Level Actual
Price LevelEzpected)
The Greek letter a represents a number that determines how much output responds to unexpected changes in the price level. In this case, assume
that a = $2 billion. That is, when the actual price level exceeds the expected price level by 1, the quantity of output supplied will exceed the natural
level of output by $2 billion.
Suppose the natural level of output is $50 billion of real GDP and that people expect a price level of 100.
On the following graph, use the purple line (diamond symbol) to plot this economy's long-run aggregate supply (LRAS) curve. Then use the orange
line segments (square symbol) to plot the economy's short-run aggregate supply (AS) curve at each of the following price levels: 90, 95, 100, 105,
and 110.
Transcribed Image Text:125
120
AS
115
110
105
LRAS
100
95
90
85
80
75
10
20
30
40
50
60
70
80
90
100
OUTPUT (Billions of dollars)
The short-run quantity of output supplied by firms will fall below the natural level of output when the actual price level
the price
level that people expected.
PRICE LEVEL
Expert Solution
This question has been solved!
Explore an expertly crafted, step-by-step solution for a thorough understanding of key concepts.

This is a popular solution!

Trending now
This is a popular solution!

Step by step
Solved in 3 steps with 2 images

Knowledge Booster


Learn more about
Need a deep-dive on the concept behind this application? Look no further. Learn more about this topic, economics and related others by exploring similar questions and additional content below.Recommended textbooks for you
Brief Principles of Macroeconomics (MindTap Cours…
Economics
ISBN:
9781337091985
Author:
N. Gregory Mankiw
Publisher:
Cengage Learning

Essentials of Economics (MindTap Course List)
Economics
ISBN:
9781337091992
Author:
N. Gregory Mankiw
Publisher:
Cengage Learning

Principles of Economics 2e
Economics
ISBN:
9781947172364
Author:
Steven A. Greenlaw; David Shapiro
Publisher:
OpenStax
Brief Principles of Macroeconomics (MindTap Cours…
Economics
ISBN:
9781337091985
Author:
N. Gregory Mankiw
Publisher:
Cengage Learning
Essentials of Economics (MindTap Course List)
Economics
ISBN:
9781337091992
Author:
N. Gregory Mankiw
Publisher:
Cengage Learning
Principles of Economics 2e
Economics
ISBN:
9781947172364
Author:
Steven A. Greenlaw; David Shapiro
Publisher:
OpenStax

Principles of Economics (MindTap Course List)
Economics
ISBN:
9781305585126
Author:
N. Gregory Mankiw
Publisher:
Cengage Learning

Principles of Economics, 7th Edition (MindTap Cou…
Economics
ISBN:
9781285165875
Author:
N. Gregory Mankiw
Publisher:
Cengage Learning

Principles of Macroeconomics (MindTap Course List)
Economics
ISBN:
9781305971509
Author:
N. Gregory Mankiw
Publisher:
Cengage Learning