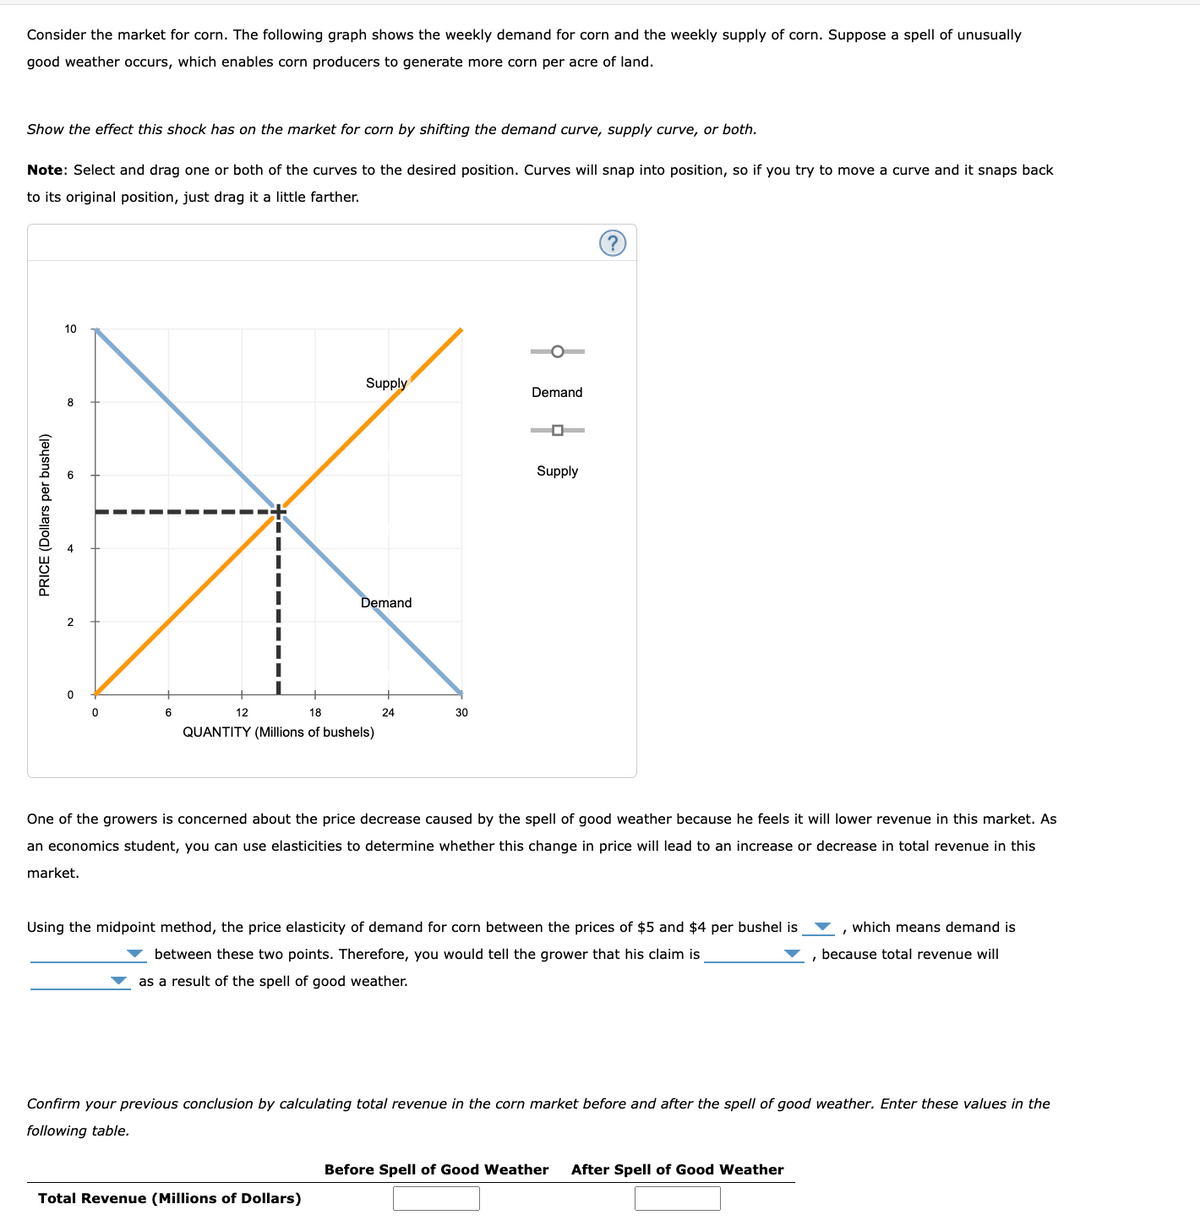
Consider the market for corn. The following graph shows the weekly demand for corn and the weekly supply of corn. Suppose a spell of unusually good weather occurs, which enables corn producers to generate more corn per acre of land. Show the effect this shock has on the market for corn by shifting the demand curve, supply curve, or both. Note: Select and drag one or both of the curves to the desired position. Curves will snap into position, so if you try to move a curve and it snaps back to its original position, just drag it a little farther.
Consider the market for corn. The following graph shows the weekly demand for corn and the weekly supply of corn. Suppose a spell of unusually good weather occurs, which enables corn producers to generate more corn per acre of land. Show the effect this shock has on the market for corn by shifting the demand curve, supply curve, or both. Note: Select and drag one or both of the curves to the desired position. Curves will snap into position, so if you try to move a curve and it snaps back to its original position, just drag it a little farther.

Microeconomics: Private and Public Choice (MindTap Course List)
16th Edition
ISBN:9781305506893
Author:James D. Gwartney, Richard L. Stroup, Russell S. Sobel, David A. Macpherson
Publisher:James D. Gwartney, Richard L. Stroup, Russell S. Sobel, David A. Macpherson
Chapter9: Price Takers And The Competitive Process
Section: Chapter Questions
Problem 11CQ

Related questions
Question
100%
I mostly need help with the toal revenue calculations at the bottom of the screenshot and how to understand how to adjust the graph according to the provided information. If you could also briefly go over the fill in the blank questions too that would be great. I want to understand how those answers are used in the calculation of the total revenue values. Thanks!
Transcribed Image Text:Consider the market for corn. The following graph shows the weekly demand for corn and the weekly supply of corn. Suppose a spell of unusually
good weather occurs, which enables corn producers to generate more corn per acre of land.
Show the effect this shock has on the market for corn by shifting the demand curve, supply curve, or both.
Note: Select and drag one or both of the curves to the desired position. Curves will snap into position, so if you try to move a curve and it snaps back
to its original position, just drag it a little farther.
10
Supply
Demand
8
Supply
Demand
2
6
12
18
24
30
QUANTITY (Millions of bushels)
One of the growers is concerned about the price decrease caused by the spell of good weather because he feels it will lower revenue in this market. As
an economics student, you can use elasticities to determine whether this change in price will lead to an increase or decrease in total revenue in this
market.
Using the midpoint method, the price elasticity of demand for corn between the prices of $5 and $4 per bushel is
which means demand is
between these two points. Therefore, you would tell the grower that his claim is
because total revenue will
as a result of the spell of good weather.
Confirm your previous conclusion by calculating total revenue in the corn market before and after the spell of good weather. Enter these values in the
following table.
Before Spell of Good Weather
After Spell of Good Weather
Total Revenue (Millions of Dollars)
PRICE (Dollars per bushel)
Expert Solution
This question has been solved!
Explore an expertly crafted, step-by-step solution for a thorough understanding of key concepts.

This is a popular solution!

Trending now
This is a popular solution!

Step by step
Solved in 2 steps with 1 images

Knowledge Booster


Learn more about
Need a deep-dive on the concept behind this application? Look no further. Learn more about this topic, economics and related others by exploring similar questions and additional content below.Recommended textbooks for you
Microeconomics: Private and Public Choice (MindTa…
Economics
ISBN:
9781305506893
Author:
James D. Gwartney, Richard L. Stroup, Russell S. Sobel, David A. Macpherson
Publisher:
Cengage Learning

Macroeconomics: Private and Public Choice (MindTa…
Economics
ISBN:
9781305506756
Author:
James D. Gwartney, Richard L. Stroup, Russell S. Sobel, David A. Macpherson
Publisher:
Cengage Learning

Economics: Private and Public Choice (MindTap Cou…
Economics
ISBN:
9781305506725
Author:
James D. Gwartney, Richard L. Stroup, Russell S. Sobel, David A. Macpherson
Publisher:
Cengage Learning
Microeconomics: Private and Public Choice (MindTa…
Economics
ISBN:
9781305506893
Author:
James D. Gwartney, Richard L. Stroup, Russell S. Sobel, David A. Macpherson
Publisher:
Cengage Learning
Macroeconomics: Private and Public Choice (MindTa…
Economics
ISBN:
9781305506756
Author:
James D. Gwartney, Richard L. Stroup, Russell S. Sobel, David A. Macpherson
Publisher:
Cengage Learning
Economics: Private and Public Choice (MindTap Cou…
Economics
ISBN:
9781305506725
Author:
James D. Gwartney, Richard L. Stroup, Russell S. Sobel, David A. Macpherson
Publisher:
Cengage Learning


Economics (MindTap Course List)
Economics
ISBN:
9781337617383
Author:
Roger A. Arnold
Publisher:
Cengage Learning