In the table below, record the color that you observe for each spot or component of each spot after the run is completed. For the retention factor, R₁, write in the numerator (top) the number of mm that the spot has moved and in the denominator (bottom) the number of mm that the solvent has moved from the point where the samples were 'spotted. Calculate the Rf vale for each spot or component of each spot. Im having a difficult time finding the Retention Factor for M&Ms by using Salt water and seeing how much each color moves Instructions Coffee filters usually are round, but it's easier to compare your results if the paper is rectangular. So, your first task is to cut the coffee filter into a rectangle. Measure and cut a 2-3/4" by 7" strip from the middle of a coffee filter. This is easily done by folding the filter in half (to make a half-circle) and then folding the half-circle into thirds. Cut along the 13-fold lines and trim the ends to make a rectangle. 2. Using a pencil (ink from a pen would run, so pencil is required), draw a line ¾" from the edge of one end of the paper. 3. Make small pencil dots for as many samples you have along this line, about 1/4" apart. There will be room for about ten dots. Underneath each dot, label the samples with a single letter code (create your own code). 4. If using colored candies, space 6 drops of water (or however many colors you are testing) equally distant on a plate or piece of foil. Position one candy of each color on the drops. Give the color a few minutes to come off into the water. Pick up the candy and eat it or throw it away. 5. Dip a toothpick into a color and dab the color onto the pencil dot for that color. Use a clean toothpick for each color. Try to keep each dot as small as possible. Allow the filter paper to dry, then go back and add more color to each dot, a minimum of three times (up to six is better), so you have lots of pigment in each sample. This process is known as spotting your sample. 6. If using food colorings, dispense a drop of each food coloring onto a plate and spot it on the paper as described above in 5. Also create a mixture of two to three of the food colorings and spot the mixture on the paper. 7. If using markers make as small a dot as possible on the paper with separate markers at each pencil dot. Spot the markers three to six times each on the same dot (as above in 5) to increase the amount of pigment. Just need the sheet looked at. Sample Code Identity of Sample Color of Spot Retention Factor
In the table below, record the color that you observe for each spot or component of each spot after the run is completed. For the retention factor, R₁, write in the numerator (top) the number of mm that the spot has moved and in the denominator (bottom) the number of mm that the solvent has moved from the point where the samples were 'spotted. Calculate the Rf vale for each spot or component of each spot. Im having a difficult time finding the Retention Factor for M&Ms by using Salt water and seeing how much each color moves Instructions Coffee filters usually are round, but it's easier to compare your results if the paper is rectangular. So, your first task is to cut the coffee filter into a rectangle. Measure and cut a 2-3/4" by 7" strip from the middle of a coffee filter. This is easily done by folding the filter in half (to make a half-circle) and then folding the half-circle into thirds. Cut along the 13-fold lines and trim the ends to make a rectangle. 2. Using a pencil (ink from a pen would run, so pencil is required), draw a line ¾" from the edge of one end of the paper. 3. Make small pencil dots for as many samples you have along this line, about 1/4" apart. There will be room for about ten dots. Underneath each dot, label the samples with a single letter code (create your own code). 4. If using colored candies, space 6 drops of water (or however many colors you are testing) equally distant on a plate or piece of foil. Position one candy of each color on the drops. Give the color a few minutes to come off into the water. Pick up the candy and eat it or throw it away. 5. Dip a toothpick into a color and dab the color onto the pencil dot for that color. Use a clean toothpick for each color. Try to keep each dot as small as possible. Allow the filter paper to dry, then go back and add more color to each dot, a minimum of three times (up to six is better), so you have lots of pigment in each sample. This process is known as spotting your sample. 6. If using food colorings, dispense a drop of each food coloring onto a plate and spot it on the paper as described above in 5. Also create a mixture of two to three of the food colorings and spot the mixture on the paper. 7. If using markers make as small a dot as possible on the paper with separate markers at each pencil dot. Spot the markers three to six times each on the same dot (as above in 5) to increase the amount of pigment. Just need the sheet looked at. Sample Code Identity of Sample Color of Spot Retention Factor

Chapter4: Least-squares And Calibration Methods
Section: Chapter Questions
Problem 3P

Related questions
Question
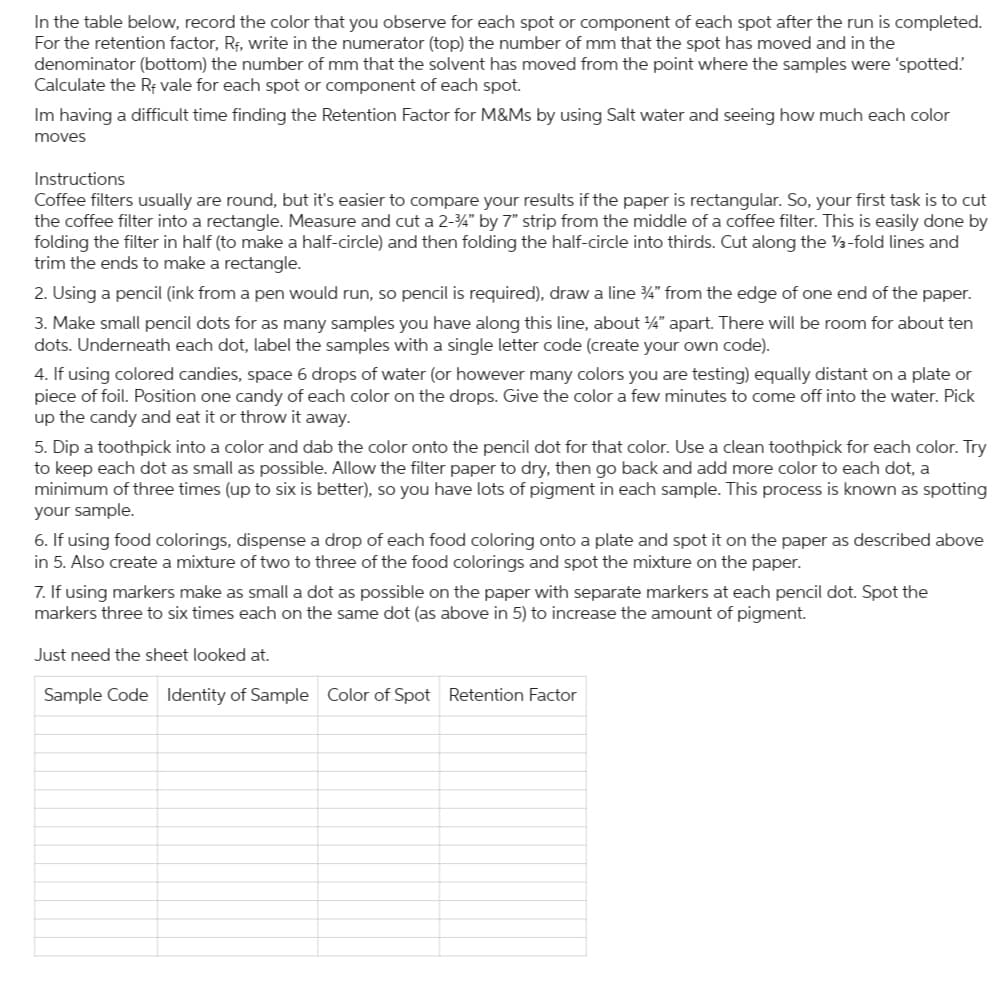
Transcribed Image Text:In the table below, record the color that you observe for each spot or component of each spot after the run is completed.
For the retention factor, R₁, write in the numerator (top) the number of mm that the spot has moved and in the
denominator (bottom) the number of mm that the solvent has moved from the point where the samples were 'spotted.
Calculate the Rf vale for each spot or component of each spot.
Im having a difficult time finding the Retention Factor for M&Ms by using Salt water and seeing how much each color
moves
Instructions
Coffee filters usually are round, but it's easier to compare your results if the paper is rectangular. So, your first task is to cut
the coffee filter into a rectangle. Measure and cut a 2-3/4" by 7" strip from the middle of a coffee filter. This is easily done by
folding the filter in half (to make a half-circle) and then folding the half-circle into thirds. Cut along the 13-fold lines and
trim the ends to make a rectangle.
2. Using a pencil (ink from a pen would run, so pencil is required), draw a line ¾" from the edge of one end of the paper.
3. Make small pencil dots for as many samples you have along this line, about 1/4" apart. There will be room for about ten
dots. Underneath each dot, label the samples with a single letter code (create your own code).
4. If using colored candies, space 6 drops of water (or however many colors you are testing) equally distant on a plate or
piece of foil. Position one candy of each color on the drops. Give the color a few minutes to come off into the water. Pick
up the candy and eat it or throw it away.
5. Dip a toothpick into a color and dab the color onto the pencil dot for that color. Use a clean toothpick for each color. Try
to keep each dot as small as possible. Allow the filter paper to dry, then go back and add more color to each dot, a
minimum of three times (up to six is better), so you have lots of pigment in each sample. This process is known as spotting
your sample.
6. If using food colorings, dispense a drop of each food coloring onto a plate and spot it on the paper as described above
in 5. Also create a mixture of two to three of the food colorings and spot the mixture on the paper.
7. If using markers make as small a dot as possible on the paper with separate markers at each pencil dot. Spot the
markers three to six times each on the same dot (as above in 5) to increase the amount of pigment.
Just need the sheet looked at.
Sample Code Identity of Sample Color of Spot Retention Factor
AI-Generated Solution

Unlock instant AI solutions
Tap the button
to generate a solution
Recommended textbooks for you

EBK A SMALL SCALE APPROACH TO ORGANIC L
Chemistry
ISBN:
9781305446021
Author:
Lampman
Publisher:
CENGAGE LEARNING - CONSIGNMENT
EBK A SMALL SCALE APPROACH TO ORGANIC L
Chemistry
ISBN:
9781305446021
Author:
Lampman
Publisher:
CENGAGE LEARNING - CONSIGNMENT

Principles of Instrumental Analysis
Chemistry
ISBN:
9781305577213
Author:
Douglas A. Skoog, F. James Holler, Stanley R. Crouch
Publisher:
Cengage Learning

Chemical Principles in the Laboratory
Chemistry
ISBN:
9781305264434
Author:
Emil Slowinski, Wayne C. Wolsey, Robert Rossi
Publisher:
Brooks Cole