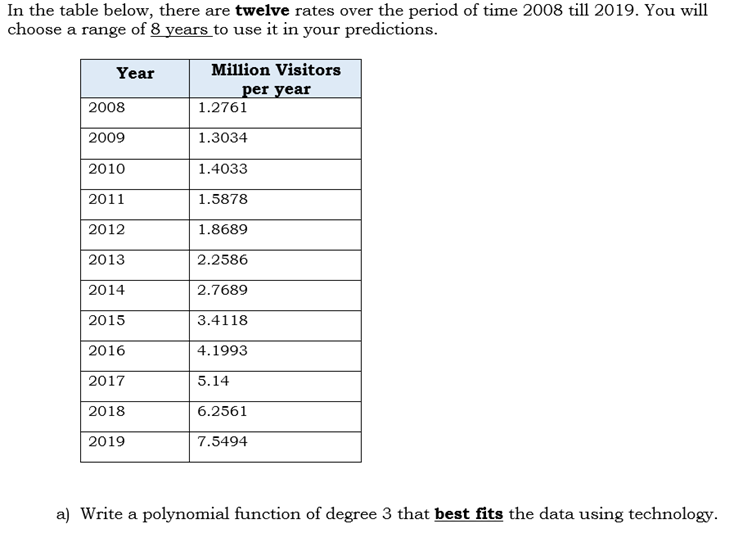
In the table below, there are twelve rates over the period of time 2008 till 2019. You will choose a range of 8 years to use it in your predictions. Year Million Visitors per year 2008 1.2761 2009 1.3034 2010 1.4033 2011 1.5878 2012 1.8689 2013 2.2586 2014 2.7689 2015 3.4118 2016 4.1993 2017 5.14 2018 6.2561 2019 7.5494 a) Write a polynomial function of degree 3 that best fits the data using technology.
In the table below, there are twelve rates over the period of time 2008 till 2019. You will choose a range of 8 years to use it in your predictions. Year Million Visitors per year 2008 1.2761 2009 1.3034 2010 1.4033 2011 1.5878 2012 1.8689 2013 2.2586 2014 2.7689 2015 3.4118 2016 4.1993 2017 5.14 2018 6.2561 2019 7.5494 a) Write a polynomial function of degree 3 that best fits the data using technology.

Chapter12: Sequences, Series And Binomial Theorem
Section12.3: Geometric Sequences And Series
Problem 12.58TI: What is the total effect on the economy of a government tax rebate of $500 to each household in...

Related questions
Question
Transcribed Image Text:In the table below, there are twelve rates over the period of time 2008 till 2019. You will
choose a range of 8 years to use it in your predictions.
Year
Million Visitors
per year
2008
1.2761
2009
1.3034
2010
1.4033
2011
1.5878
2012
1.8689
2013
2.2586
2014
2.7689
2015
3.4118
2016
4.1993
2017
5.14
2018
6.2561
2019
7.5494
a) Write a polynomial function of degree 3 that best fits the data using technology.
Expert Solution
This question has been solved!
Explore an expertly crafted, step-by-step solution for a thorough understanding of key concepts.

Step by step
Solved in 2 steps with 1 images

Recommended textbooks for you

Glencoe Algebra 1, Student Edition, 9780079039897…
Algebra
ISBN:
9780079039897
Author:
Carter
Publisher:
McGraw Hill
Glencoe Algebra 1, Student Edition, 9780079039897…
Algebra
ISBN:
9780079039897
Author:
Carter
Publisher:
McGraw Hill