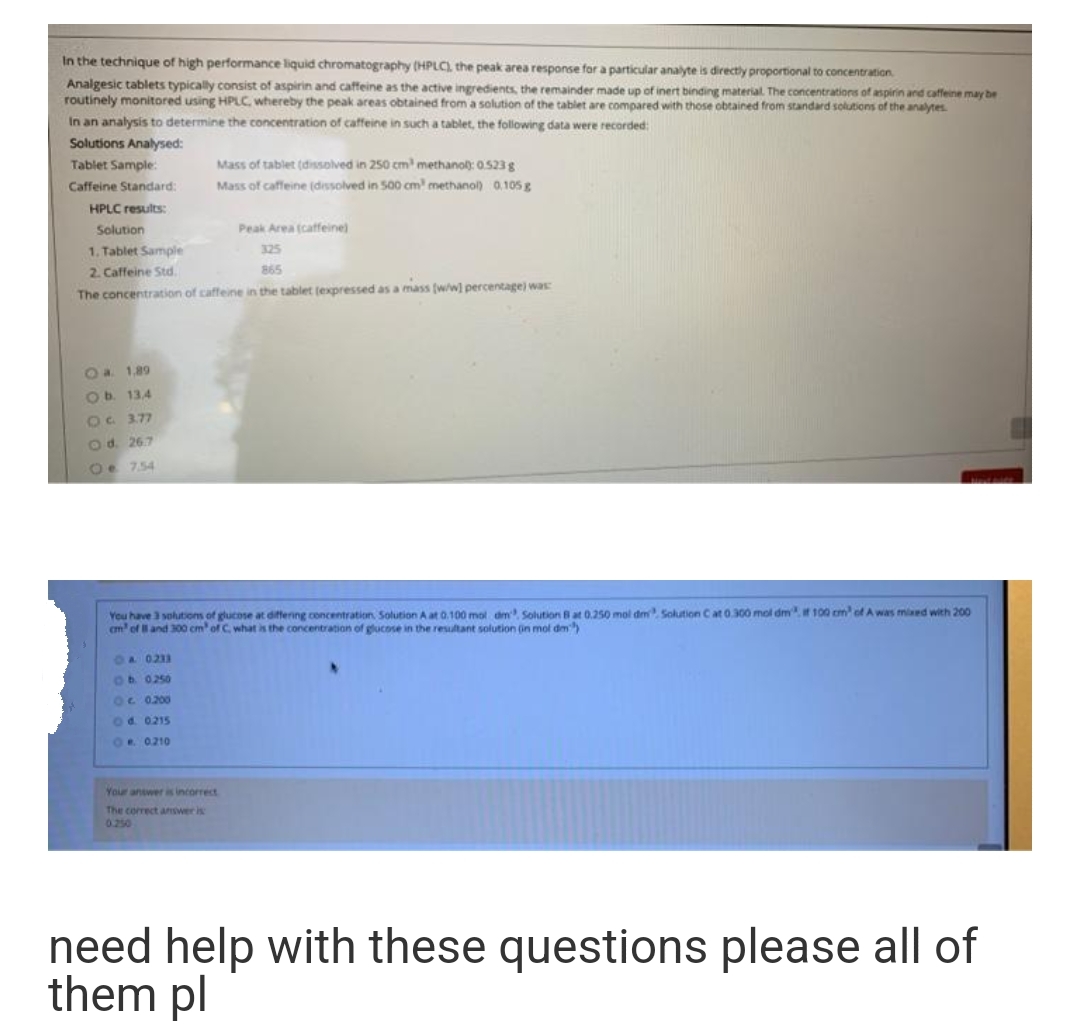
In the technique of high performance liquid chromatography (HPLC) the peak area response for a particular analyte is directly proportional to concentration Analgesic tablets typically consist of aspirin and caffeine as the active ingredients, the remainder made up of inert binding material. The concentrations of aspirin and caffeine may be routinely monitored using HPLC, whereby the peak areas obtained from a solution of the tablet are compared with those obtained from standard solutions of the analytes In an analysis to determine the concentration of caffeine in such a tablet, the following data were recorded: Solutions Analysed: Tablet Sample: Caffeine Standard: HPLC results: Mass of tablet (dissolved in 250 cm methanol: 0.523 g Mass of caffeine (dissolved in 500 cm methanol) 0.105g Solution Peak Area (caffeine) 1. Tablet Sample 325 2. Caffeine Std. 865 The conrentr ablet (expressed as a mass (ww percentage) was
In the technique of high performance liquid chromatography (HPLC) the peak area response for a particular analyte is directly proportional to concentration Analgesic tablets typically consist of aspirin and caffeine as the active ingredients, the remainder made up of inert binding material. The concentrations of aspirin and caffeine may be routinely monitored using HPLC, whereby the peak areas obtained from a solution of the tablet are compared with those obtained from standard solutions of the analytes In an analysis to determine the concentration of caffeine in such a tablet, the following data were recorded: Solutions Analysed: Tablet Sample: Caffeine Standard: HPLC results: Mass of tablet (dissolved in 250 cm methanol: 0.523 g Mass of caffeine (dissolved in 500 cm methanol) 0.105g Solution Peak Area (caffeine) 1. Tablet Sample 325 2. Caffeine Std. 865 The conrentr ablet (expressed as a mass (ww percentage) was

Chapter4: Least-squares And Calibration Methods
Section: Chapter Questions
Problem 3P

Related questions
Question
Transcribed Image Text:In the technique of high performance liquid chromatography (HPLC) the peak area response for a particular analyte is directly proportional to concentration
Analgesic tablets typically consist of aspirin and caffeine as the active ingredients, the remainder made up of inert binding material. The concentrations of aspirin and caffeine may be
routinely monitored using HPLC, whereby the peak areas obtained from a solution of the tablet are compared with those obtained from standard solutions of the analytes.
In an analysis to determine the concentration of caffeine in such a tablet, the following data were recorded:
Solutions Analysed:
Tablet Sample:
Mass of tablet (dissolved in 250 cm methano): 0.523 g
Caffeine Standard:
Mass of caffeine (diessolved in 500 cm methanol) 0.105 g
HPLC results:
Solution
Peak Area (catfeine)
1. Tablet Sample
325
2. Caffeine Std.
865
The concentration of caffeine in the tablet (expressed as a mass (w/wl percentage) was
Oa 1.89
Ob 13.4
O 3.77
Od. 267
Oe 7.54
You have 3 solutions of glucose at differing concentration Solution A at 0.100 mol dm Solution Bat 0.250 mol dm sSolution Cat 0.300 mol dmt 100 cm of A was miaed with 200
cm' ofland 300 cm' of C, what is the concentration of glucose in the resultant solution (in mol dm)
OA 0233
Ob 0250
O 0200
Od. 0215
OR 0210
Your answer is incorrect
The correct answer is
0.250
need help with these questions please all of
them pl
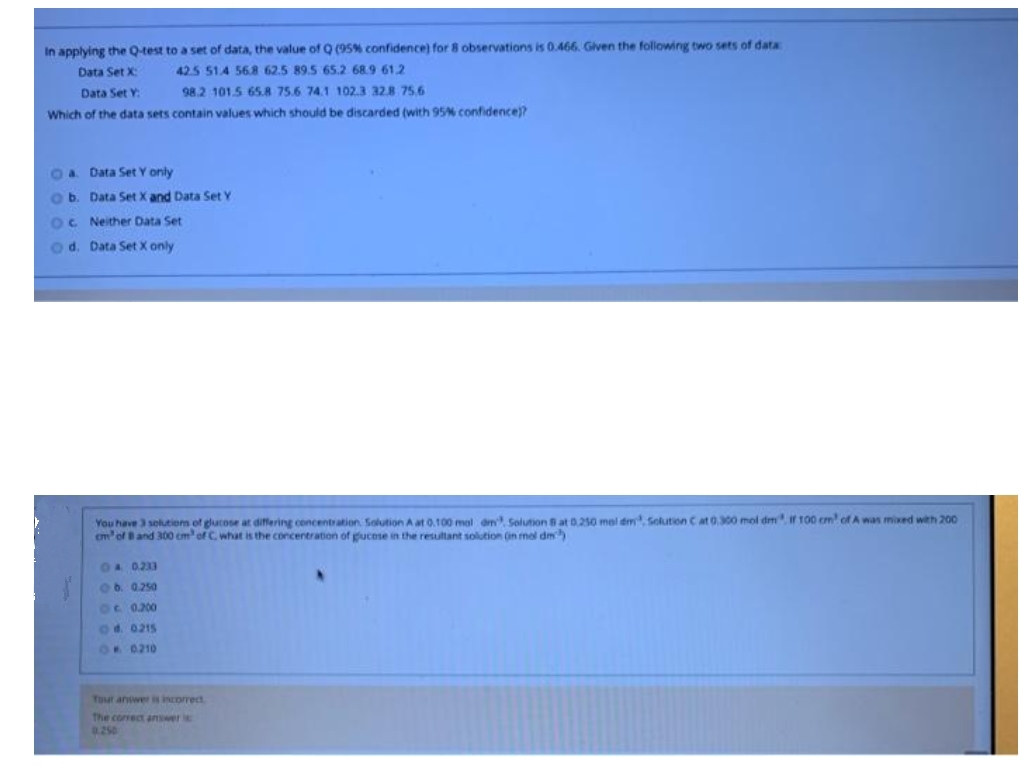
Transcribed Image Text:In applying the Q-test to a set of data, the value of Q (95% confidence) for 8 observations is 0.466. Glven the following two sets of data
Data Set X:
42.5 51.4 568 62.5 89.5 65.2 68.9 61.2
Data Set Y:
98.2 101.5 65.8 75.6 74.1 102.3 328 75.6
Which of the data sets contain values which should be discarded (with 95% confidence)?
Oa Data Set Y only
ob. Data Set X and Data Set Y
OC Neither Data Set
o d. Data Set X only
You have 3 selutiom of glutose at differing concentration. Solution A at 0.100 mal dm Solution Bat 0.250 mel dm Solution C at 0300 mol dm, if 100 cm of A was mixed weh 200
em'of Band 300 cm' of C. what is the concentration of gucese in the resultant solution (in mol dm
OA 0233
Ob. 0.250
6c 0.200
Od. 0215
OR 0210
Tuur anwer is incorrect
The correct answer i
.250
Expert Solution
This question has been solved!
Explore an expertly crafted, step-by-step solution for a thorough understanding of key concepts.

This is a popular solution!

Trending now
This is a popular solution!

Step by step
Solved in 2 steps with 1 images

Knowledge Booster


Learn more about
Need a deep-dive on the concept behind this application? Look no further. Learn more about this topic, chemistry and related others by exploring similar questions and additional content below.Recommended textbooks for you

Principles of Instrumental Analysis
Chemistry
ISBN:
9781305577213
Author:
Douglas A. Skoog, F. James Holler, Stanley R. Crouch
Publisher:
Cengage Learning

EBK A SMALL SCALE APPROACH TO ORGANIC L
Chemistry
ISBN:
9781305446021
Author:
Lampman
Publisher:
CENGAGE LEARNING - CONSIGNMENT
Principles of Instrumental Analysis
Chemistry
ISBN:
9781305577213
Author:
Douglas A. Skoog, F. James Holler, Stanley R. Crouch
Publisher:
Cengage Learning
EBK A SMALL SCALE APPROACH TO ORGANIC L
Chemistry
ISBN:
9781305446021
Author:
Lampman
Publisher:
CENGAGE LEARNING - CONSIGNMENT