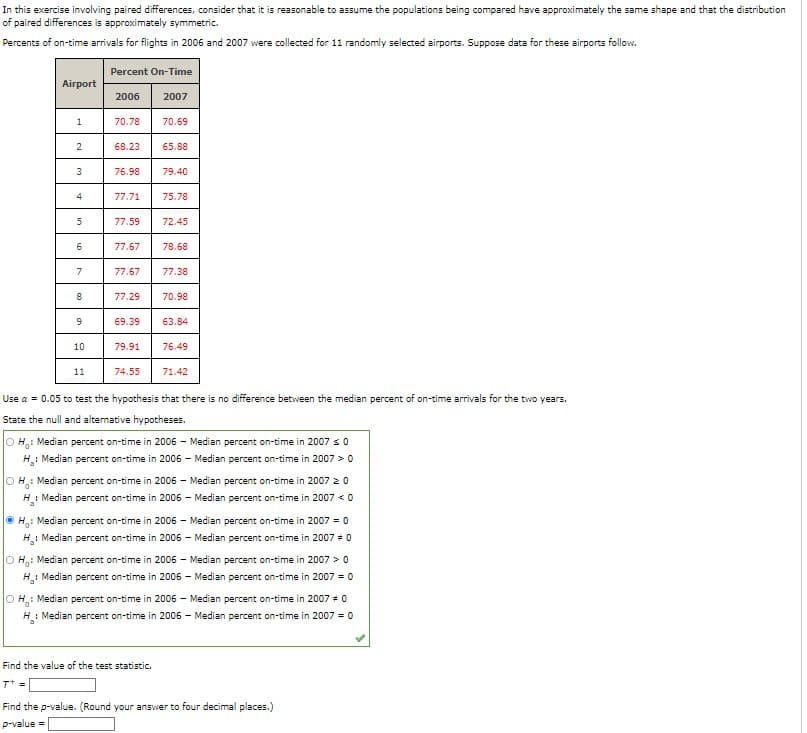
In this exercise involving paired differences, consider that it is reasonable to assume the populations being compared have approximately the same shape and that the distribution of paired differences is approximately symmetric. Percents of on-time arrivals for flights in 2006 and 2007 were collected for 11 randomly selected airports. Suppose data for these airports follow. Percent On-Time Airport 2006 2007 1 70.78 70.69 2 68.23 65.88 3 76.98 79.40 4 77.71 75.78 5 77.59 72.45 6 77.67 78.68 7 77.67 77.38 8 77.29 70.98 9 69.39 63.84 10 79.91 76.49 11 74.55 71.42 Use a = 0.05 to test the hypothesis that there is no difference between the median percent of on-time arrivals for the two years. State the null and alternative hypotheses. OH: Median percent on-time in 2006 - Median percent on-time in 2007 ≤ 0 H₂: Median percent on-time in 2006 - Median percent on-time in 2007 > 0 OH: Median percent on-time in 2006 - Median percent on-time in 2007 20 H: Median percent on-time in 2006 - Median percent on-time in 2007 <0 ⒸH: Median percent on-time in 2006- Median percent on-time in 2007 = 0 H₂: Median percent on-time in 2006 - Median percent on-time in 2007 #0 OH: Median percent on-time in 2006 - Median percent on-time in 2007 > 0 H₂: Median percent on-time in 2006 - Median percent on-time in 2007 = 0 OH: Median percent on-time in 2006 - Median percent on-time in 2007 * 0 H: Median percent on-time in 2006 - Median percent on-time in 2007 = 0 Find the value of the test statistic. TT = Find the p-value. (Round your answer to four decimal places.) p-value=
In this exercise involving paired differences, consider that it is reasonable to assume the populations being compared have approximately the same shape and that the distribution of paired differences is approximately symmetric. Percents of on-time arrivals for flights in 2006 and 2007 were collected for 11 randomly selected airports. Suppose data for these airports follow. Percent On-Time Airport 2006 2007 1 70.78 70.69 2 68.23 65.88 3 76.98 79.40 4 77.71 75.78 5 77.59 72.45 6 77.67 78.68 7 77.67 77.38 8 77.29 70.98 9 69.39 63.84 10 79.91 76.49 11 74.55 71.42 Use a = 0.05 to test the hypothesis that there is no difference between the median percent of on-time arrivals for the two years. State the null and alternative hypotheses. OH: Median percent on-time in 2006 - Median percent on-time in 2007 ≤ 0 H₂: Median percent on-time in 2006 - Median percent on-time in 2007 > 0 OH: Median percent on-time in 2006 - Median percent on-time in 2007 20 H: Median percent on-time in 2006 - Median percent on-time in 2007 <0 ⒸH: Median percent on-time in 2006- Median percent on-time in 2007 = 0 H₂: Median percent on-time in 2006 - Median percent on-time in 2007 #0 OH: Median percent on-time in 2006 - Median percent on-time in 2007 > 0 H₂: Median percent on-time in 2006 - Median percent on-time in 2007 = 0 OH: Median percent on-time in 2006 - Median percent on-time in 2007 * 0 H: Median percent on-time in 2006 - Median percent on-time in 2007 = 0 Find the value of the test statistic. TT = Find the p-value. (Round your answer to four decimal places.) p-value=

Glencoe Algebra 1, Student Edition, 9780079039897, 0079039898, 2018
18th Edition
ISBN:9780079039897
Author:Carter
Publisher:Carter
Chapter10: Statistics
Section10.4: Distributions Of Data
Problem 19PFA

Related questions
Question
Transcribed Image Text:In this exercise involving paired differences, consider that it is reasonable to assume the populations being compared have approximately the same shape and that the distribution
of paired differences is approximately symmetric.
Percents of on-time arrivals for flights in 2006 and 2007 were collected for 11 randomly selected airports. Suppose data for these airports follow.
Percent On-Time
Airport
2006
2007
1
70.78 70.69
2
68.23 65.88
3
76.98 79.40
4
77.71
75.78
5
77.59
72.45
6
77.67
78.68
7
77.67 77.38
8
77.29
70.98
9
69.39
63.84
10
79.91
76.49
11
74.55
71.42
Use a = 0.05 to test the hypothesis that there is no difference between the median percent of on-time arrivals for the two years.
State the null and alternative hypotheses.
OH: Median percent on-time in 2006 - Median percent on-time in 2007 s0
Median percent on-time in 2006- Median percent on-time in 2007 > 0
OH: Median percent on-time in 2006 - Median percent on-time in 2007 2 0
H: Median percent on-time in 2006 - Median percent on-time in 2007 < 0
ⒸH,: Median percent on-time in 2006- Median percent on-time in 2007 = 0
H₂: Median percent on-time in 2006 - Median percent on-time in 2007 # 0
OH: Median percent on-time in 2006 - Median percent on-time in 2007 > 0
Median percent on-time in 2006 - Median percent on-time in 2007 = 0
OH: Median percent on-time in 2006 - Median percent on-time in 2007 # 0
H: Median percent on-time in 2006 - Median percent on-time in 2007 = 0
Find the value of the test statistic.
T+ =
Find the p-value. (Round your answer to four decimal places.)
p-value =
Expert Solution
This question has been solved!
Explore an expertly crafted, step-by-step solution for a thorough understanding of key concepts.

Step by step
Solved in 4 steps

Recommended textbooks for you
Glencoe Algebra 1, Student Edition, 9780079039897…
Algebra
ISBN:
9780079039897
Author:
Carter
Publisher:
McGraw Hill
Glencoe Algebra 1, Student Edition, 9780079039897…
Algebra
ISBN:
9780079039897
Author:
Carter
Publisher:
McGraw Hill